Interactive Sales Dashboard Transformation
Darren Pierson
Project Summary
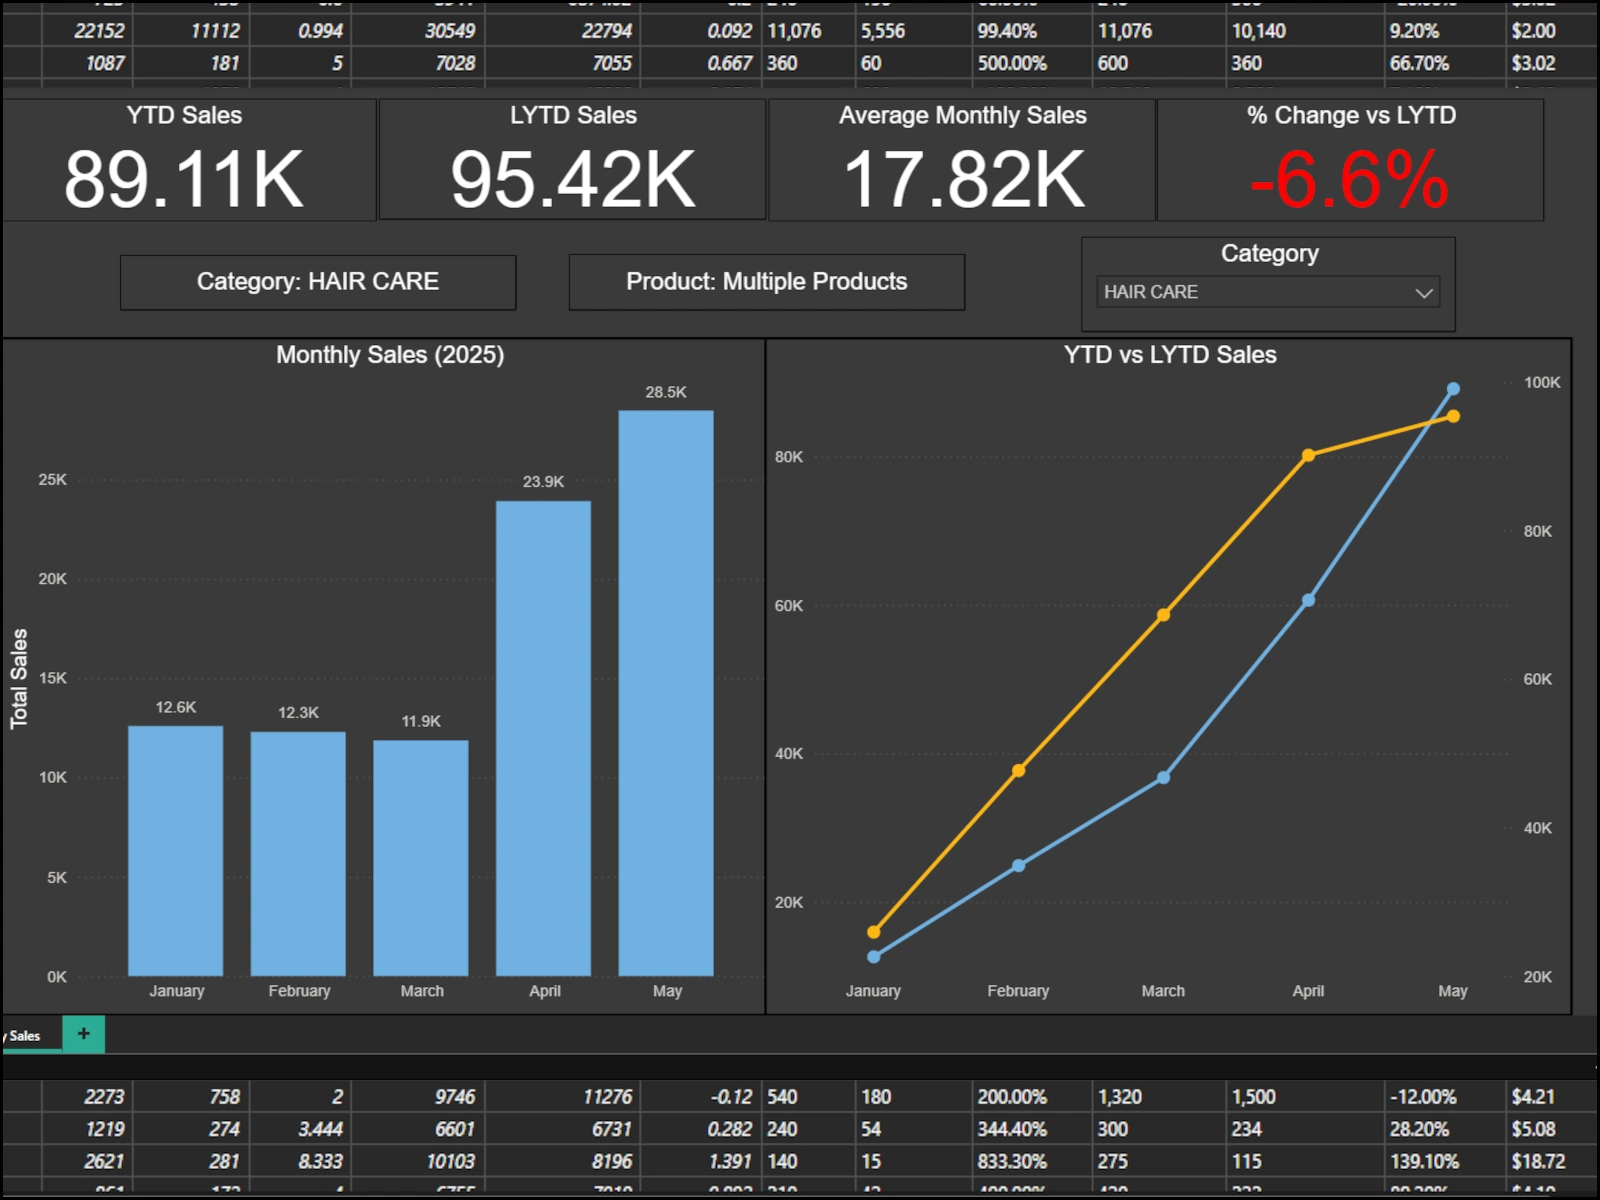
The client tracked sales in Excel with a manually updated waterfall chart, limited to total YTD vs LYTD. This approach missed monthly trends and added risk of errors.
What I Changed
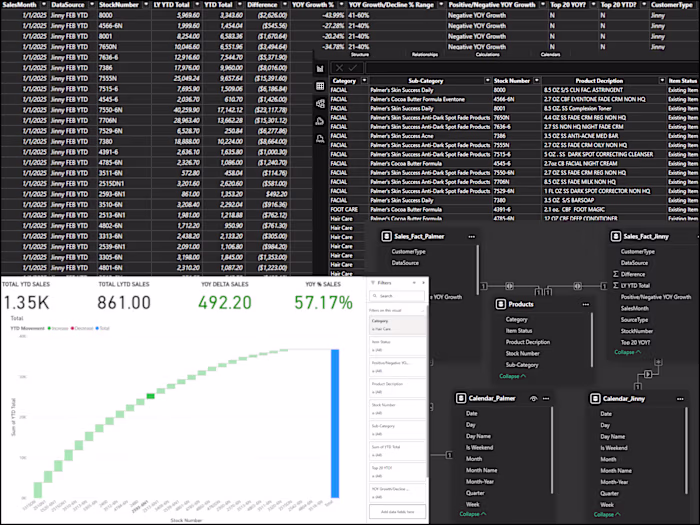
Imported full raw sales exports into Power BI
Built a relational model linking calendar, products, and categories
Created measures for YTD, LYTD, monthly totals, averages, and % change
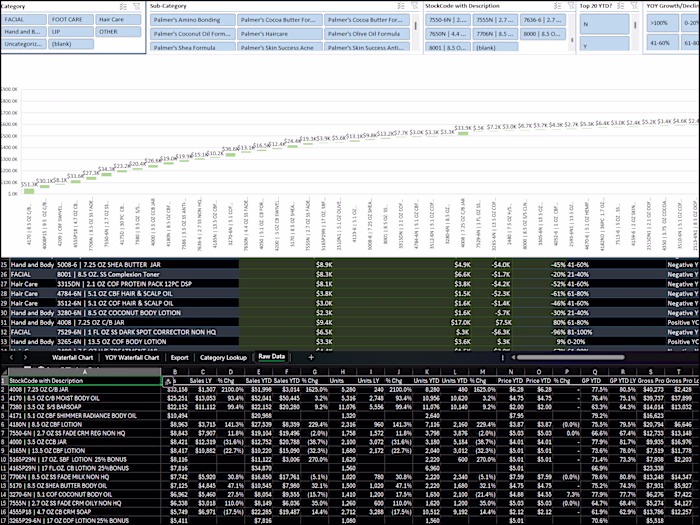
Rebuilt the static Excel waterfall into an interactive Power BI dashboard with KPI cards and trend visuals
Result
Replaced error-prone manual updates with one-click refreshes
Exposed monthly sales patterns instead of just YTD totals
Enabled category and product drilldowns through slicers
Delivered a more accurate, professional, and actionable dashboard
Tech Used
Power BI, Power Query, DAX, Data Modeling, Interactive Dashboards
Like this project
Posted Aug 16, 2025
Converted a manual Excel waterfall chart into a dynamic Power BI dashboard with YTD, LYTD, and monthly trend tracking for richer, automated insights.