Excel-to-Power BI Waterfall Transformation
Darren Pierson
Project Summary
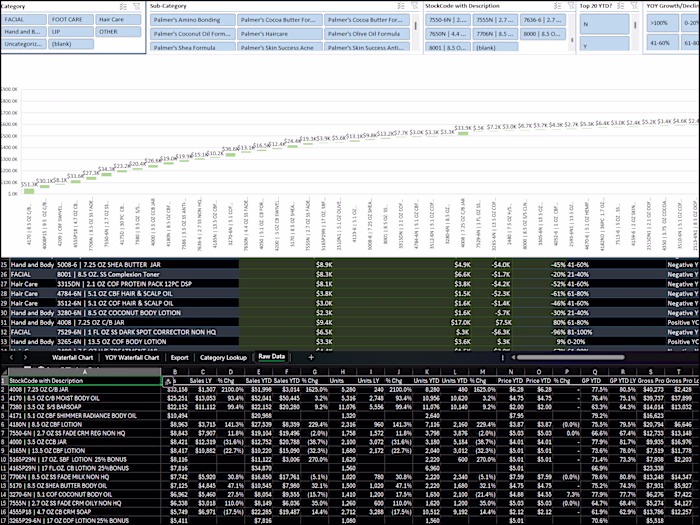
A client maintained waterfall charts in Excel using manual monthly updates and VLOOKUP-based data feeds. This process was slow, error-prone, and limited to static visuals.
What I Changed
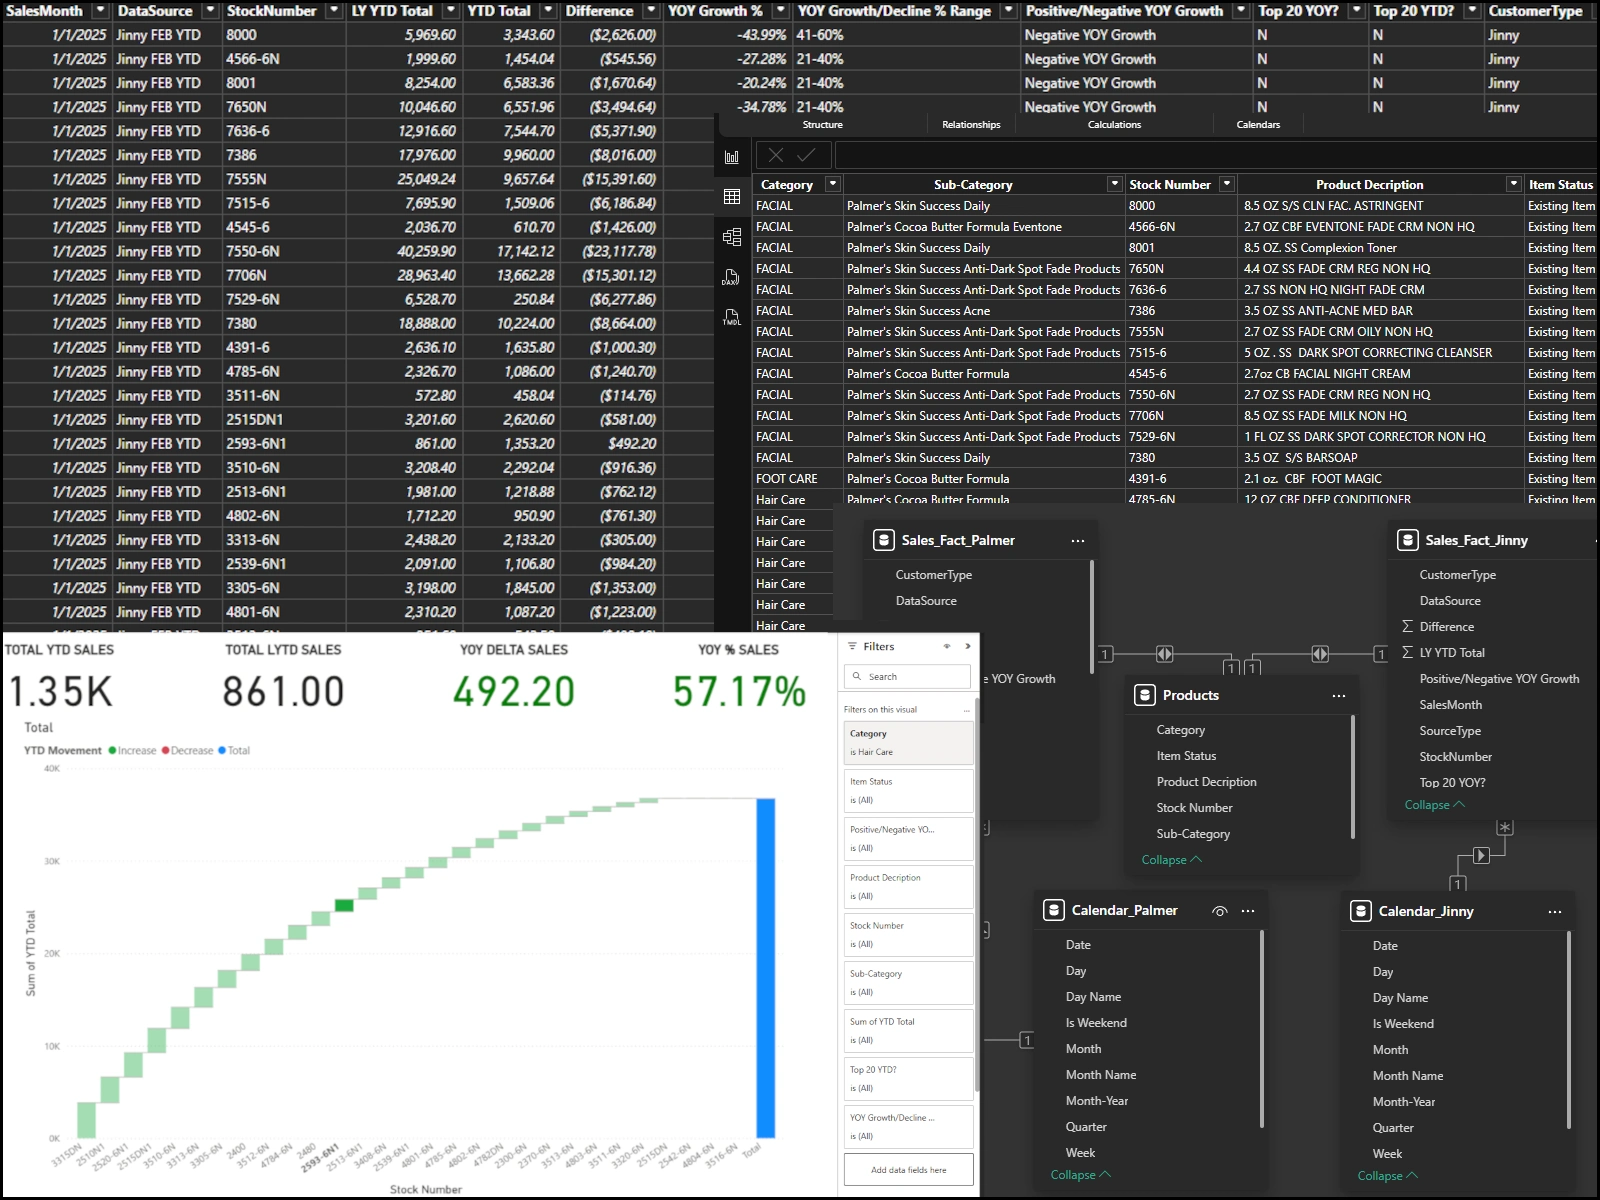
Imported and sanitized monthly export data using Power Query
Built a relational data model linking fact tables, products, and calendar tables
Created calculated measures for YTD, LYTD, YOY difference, and growth percentages
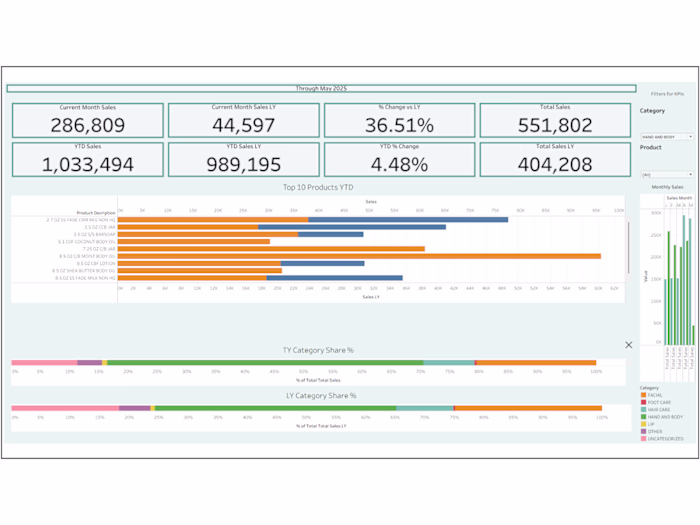
Designed an interactive waterfall chart with KPI cards and dynamic slicers
Result
Update time reduced to a simple data refresh in Power BI
Added drill-downs and filterable views for deeper analysis
Improved accuracy with standardized data handling
Delivered richer visual insights compared to static Excel charts
Tech Used
Power BI, Power Query, DAX, Data Modeling, KPI Visuals
Like this project
Posted Aug 11, 2025
Converted static Excel waterfall into dynamic Power BI dashboard with automated refresh, KPI cards, and drill-down analysis.
Likes
0
Views
5