AI Developer | Automations Engineer | Data Analyst
AI Developer | Automations Engineer | Data Analyst

Senior Software & ML Engineer | Zero to One Product Builder
Senior Software & ML Engineer | Zero to One Product Builder


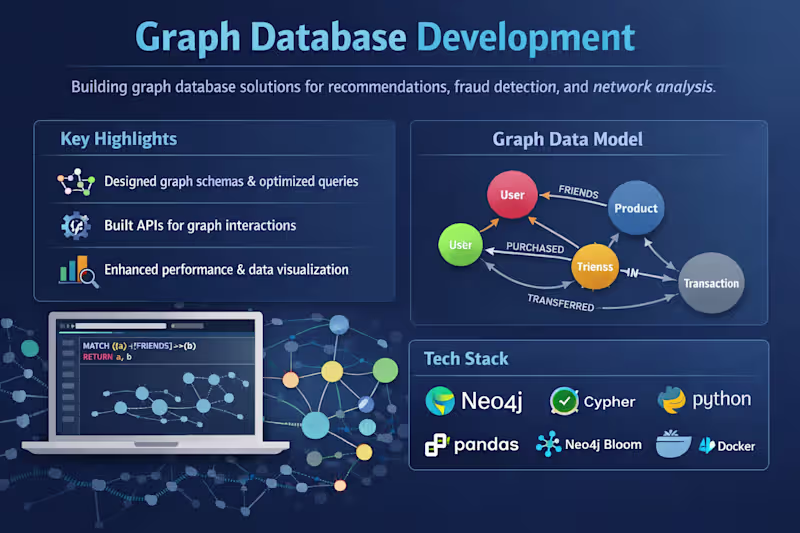
AI System Architect | Database Expert | Data Analyst
- $25k+
- Earned
- 1x
- Hired
- 5.0
- Rating
- 65
- Followers
AI System Architect | Database Expert | Data Analyst
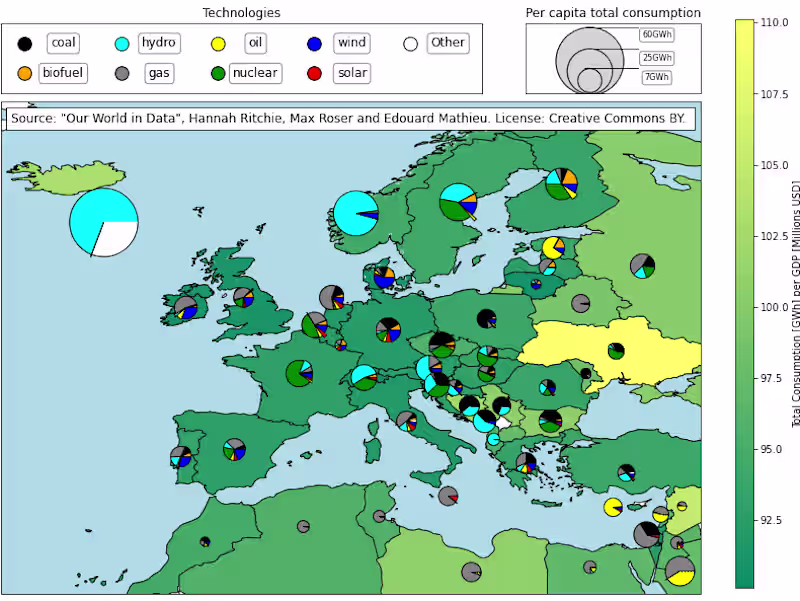
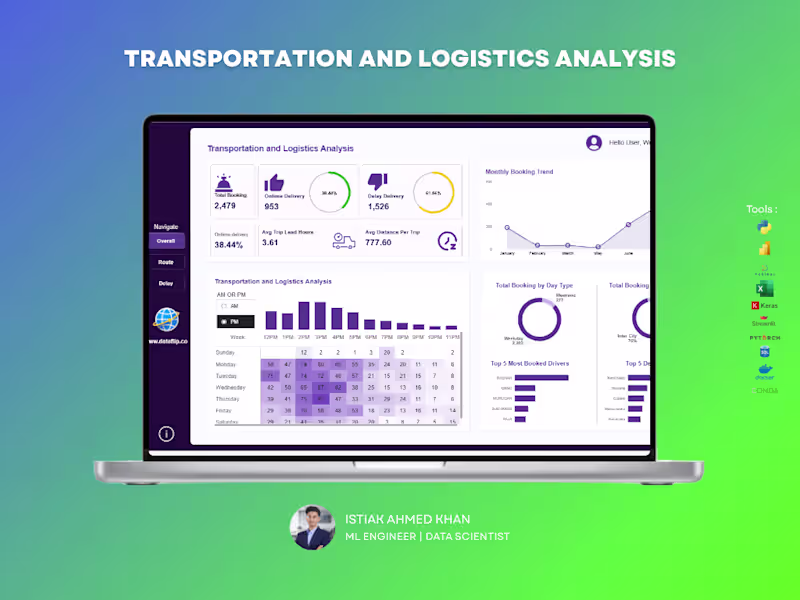
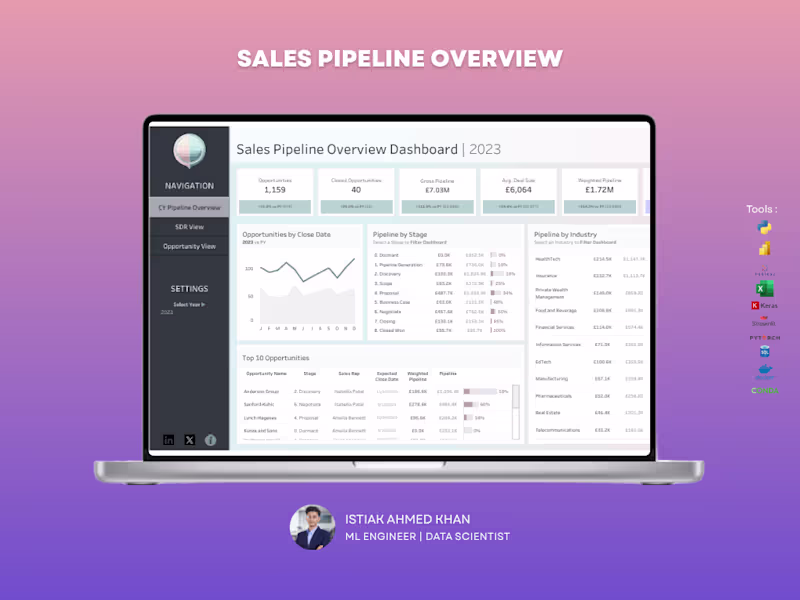
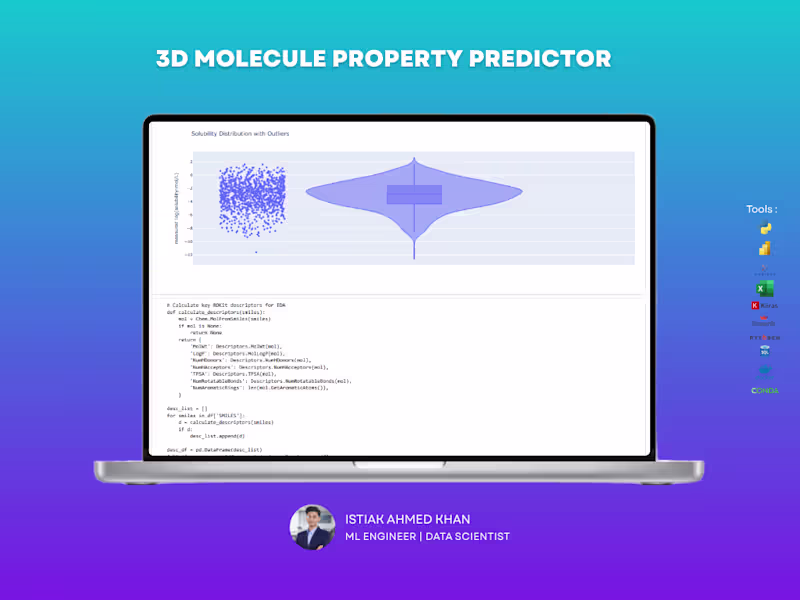
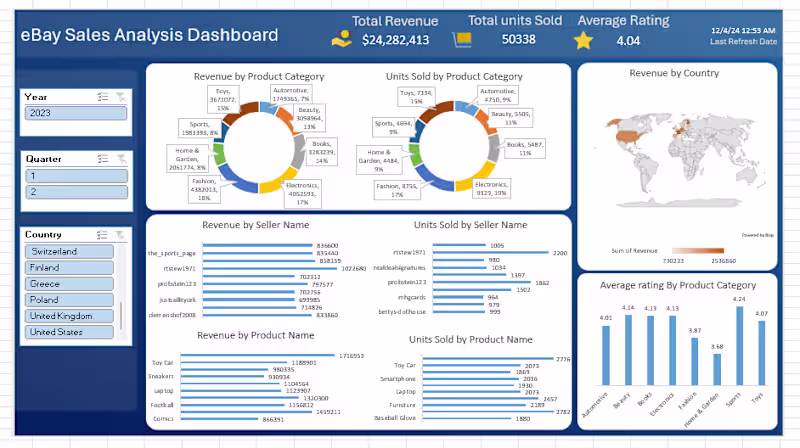
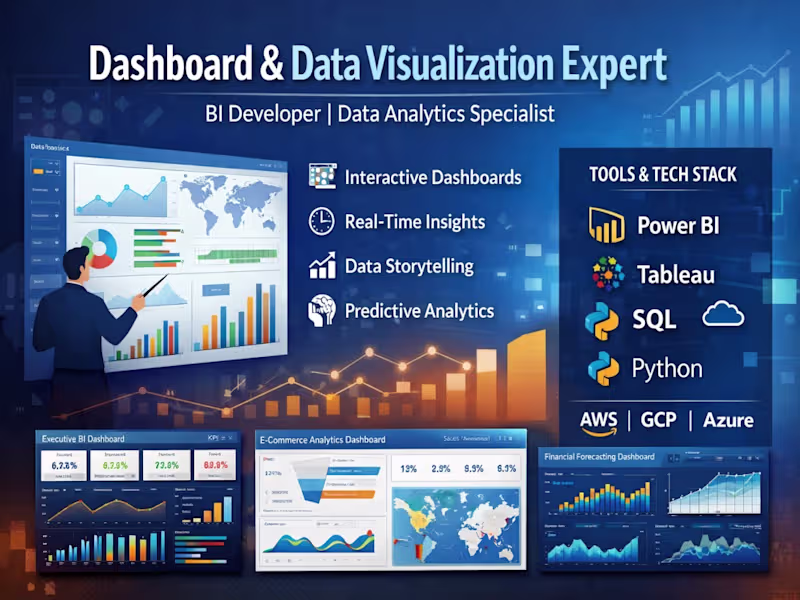
Analytics Specialist and Data Visualizer
- $1k+
- Earned
- 3x
- Hired
- 5.0
- Rating
- 36
- Followers
Analytics Specialist and Data Visualizer


Power BI Data Analyst + ML AI Automation Expert
- 5.0
- Rating
- 103
- Followers
Power BI Data Analyst + ML AI Automation Expert
Build production-ready AI applications with Machine Learning
- 13
- Followers
Build production-ready AI applications with Machine Learning
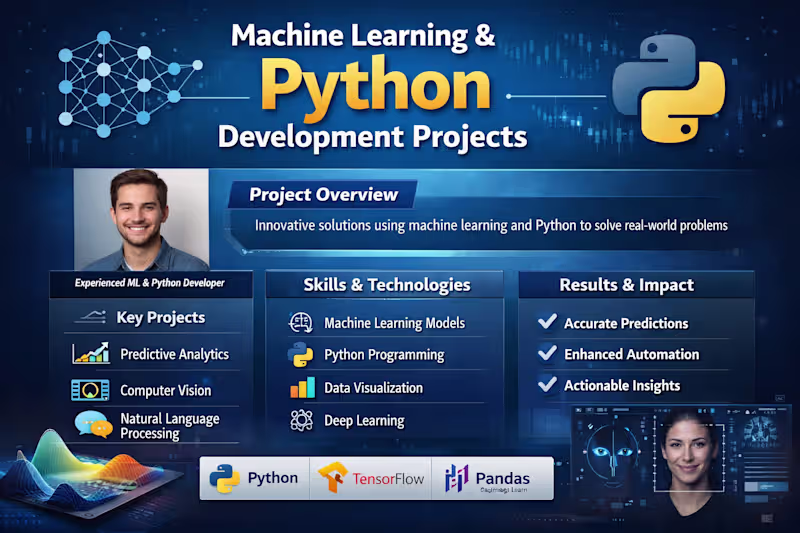

AI & ML Engineer
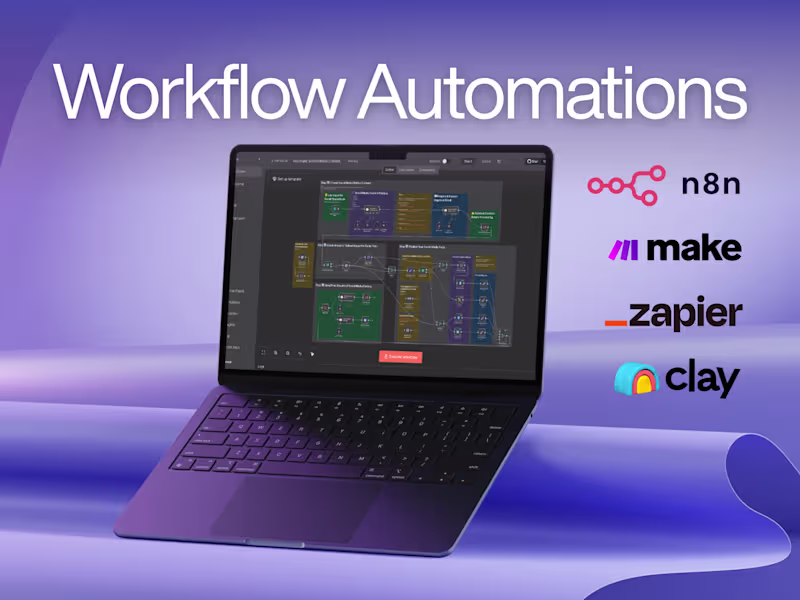
Data Analysis & Modeling within the reach of SMEs
- $1k+
- Earned
- 2x
- Hired
- 5.0
- Rating
- 8
- Followers
Data Analysis & Modeling within the reach of SMEs