Ad Creatives Designer and CAPI specialist
Ad Creatives Designer and CAPI specialist

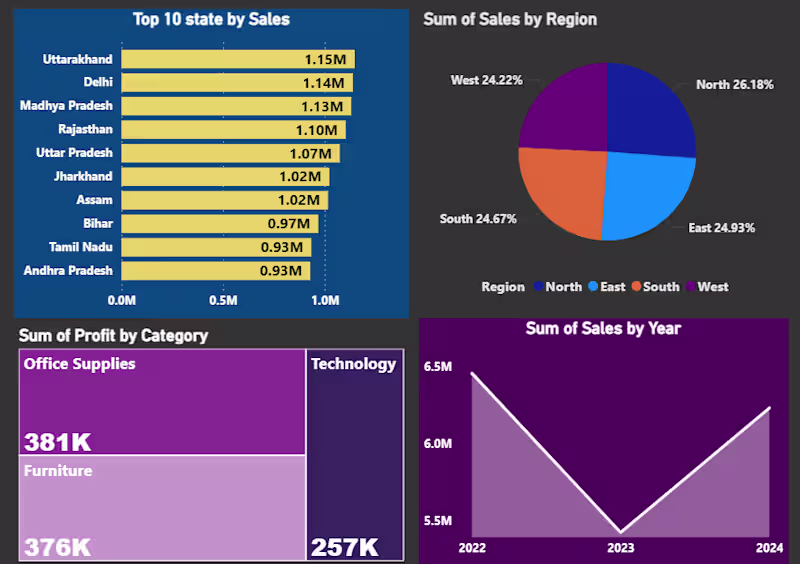
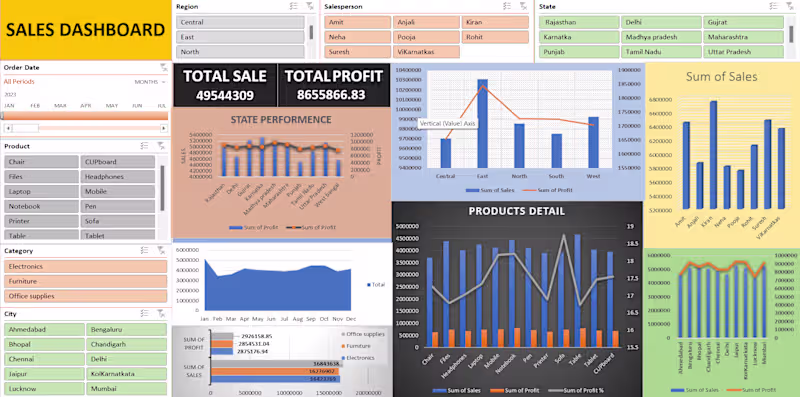
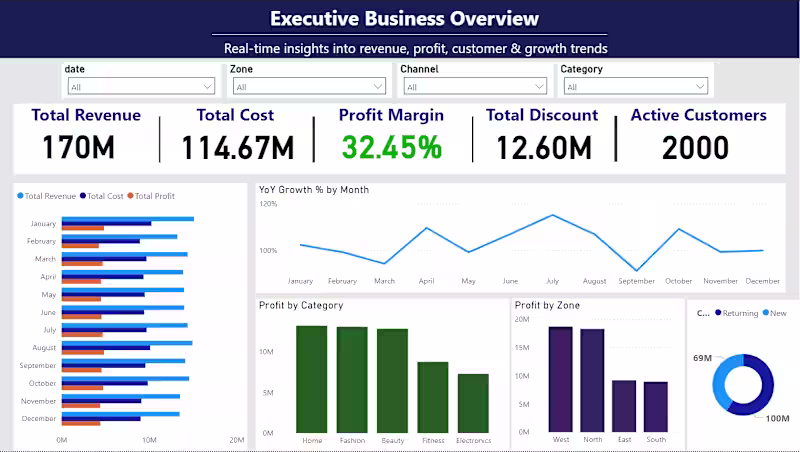
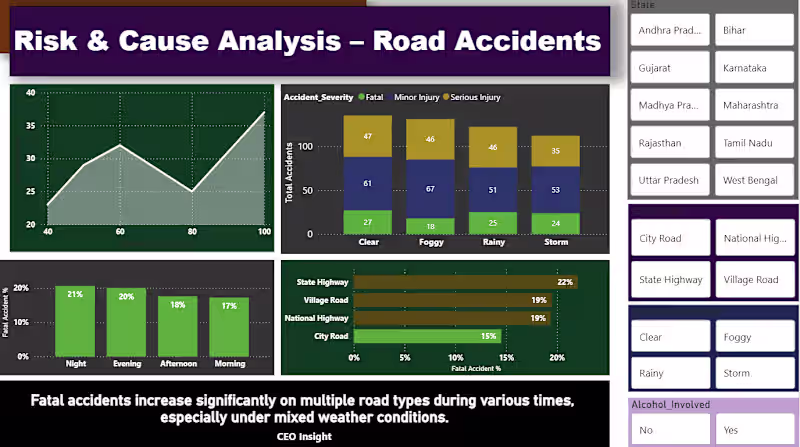
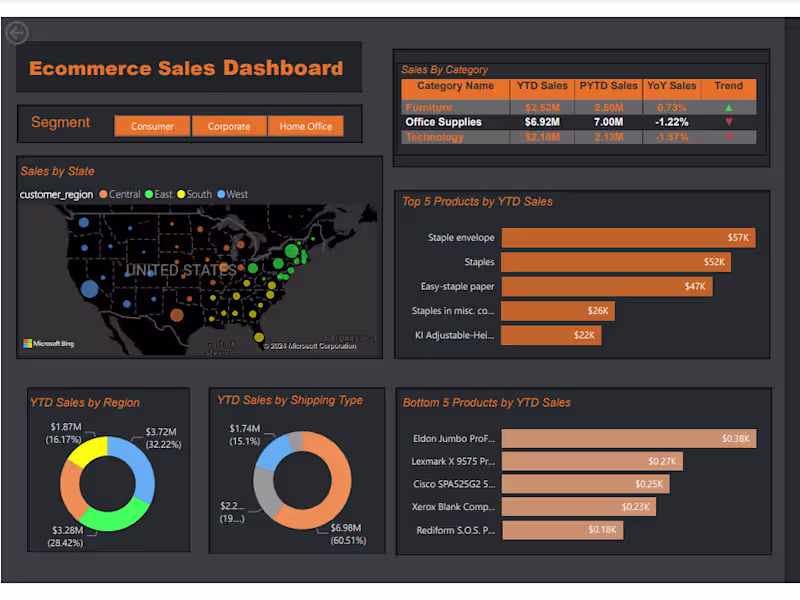
Aspiring Data Analyst skilled in Power BI & dashboards
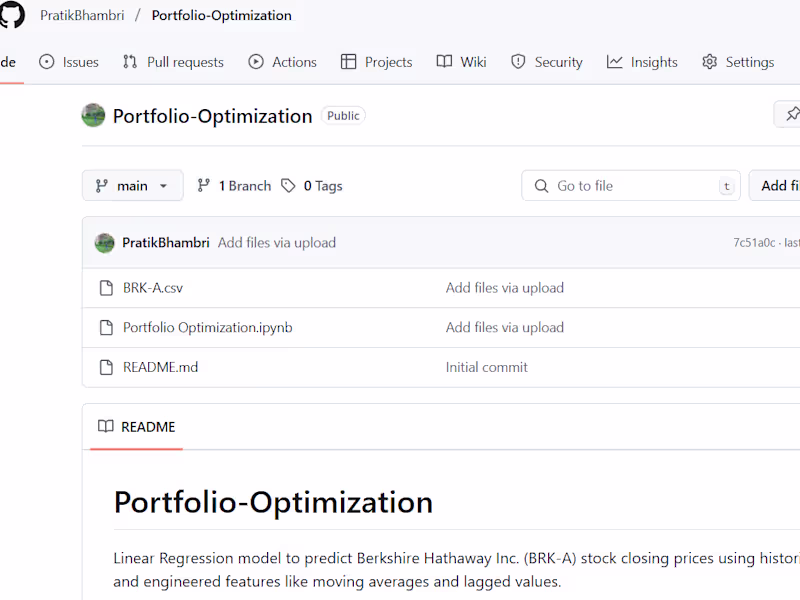
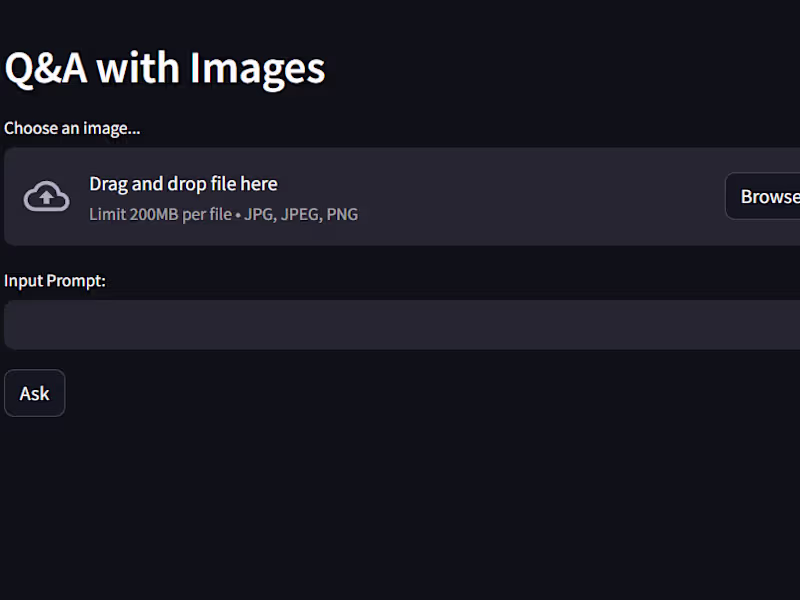
Data Scientist: Python, RStudio, ML, BI, NLP, DL, LLM
Data Scientist: Python, RStudio, ML, BI, NLP, DL, LLM
Looker Studio Expert | Google Analytics 4 & GTM expert
Looker Studio Expert | Google Analytics 4 & GTM expert
View more →
Data Insights & Stunning Visuals Expert
Data Insights & Stunning Visuals Expert
View more →
15 Yrs GIS Expert and Data Engineer 🌍
15 Yrs GIS Expert and Data Engineer 🌍


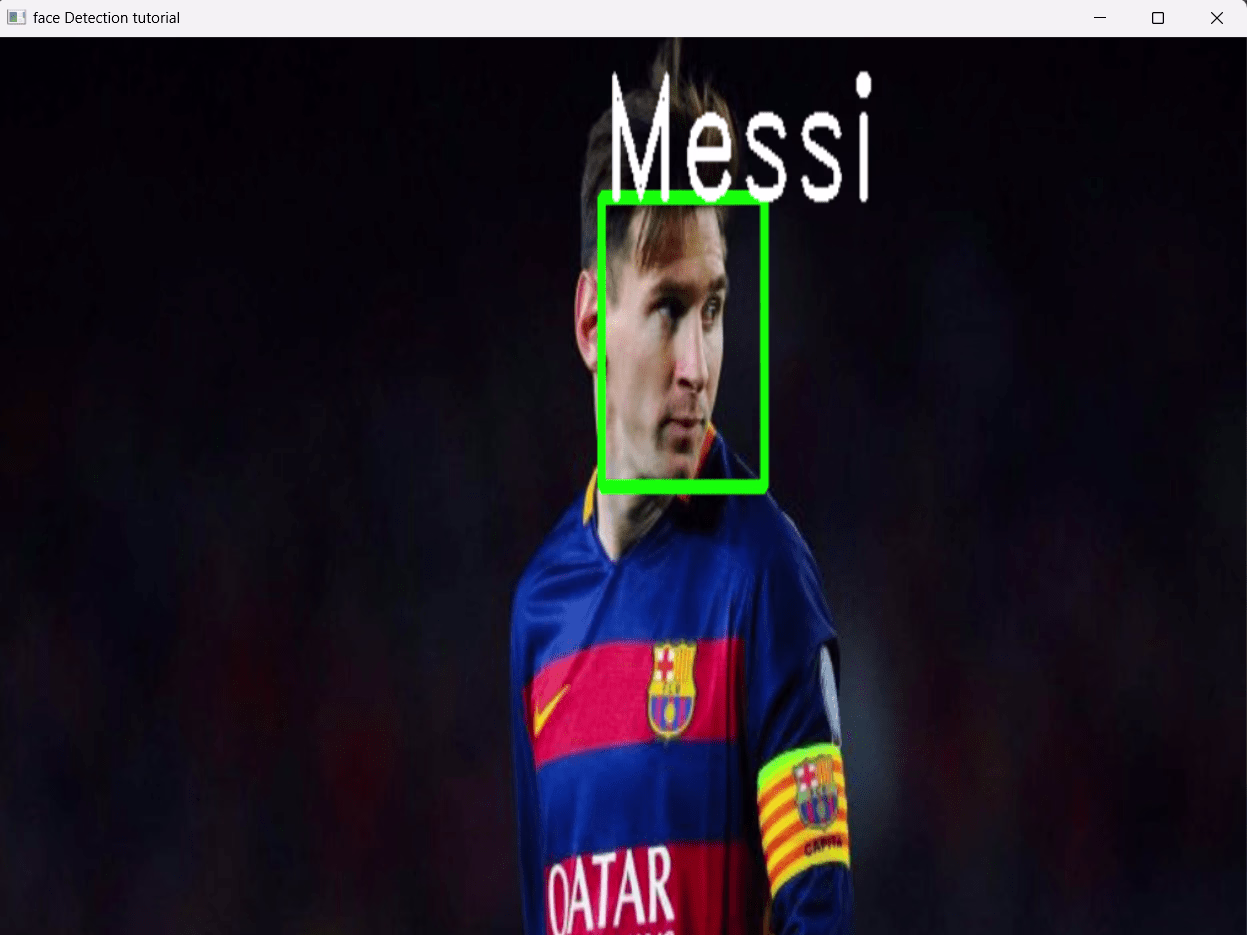
AI Data Scientist: ML, NLP, Deep Learning
AI Data Scientist: ML, NLP, Deep Learning

View more →
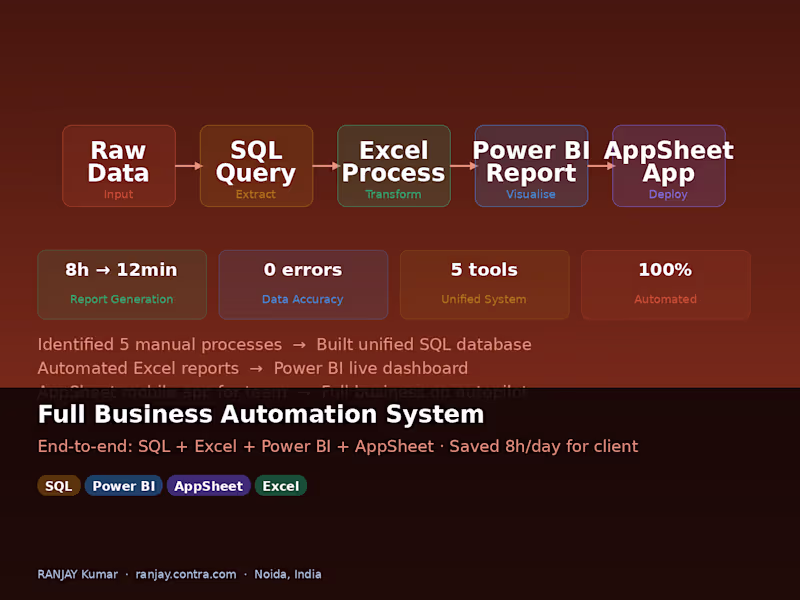
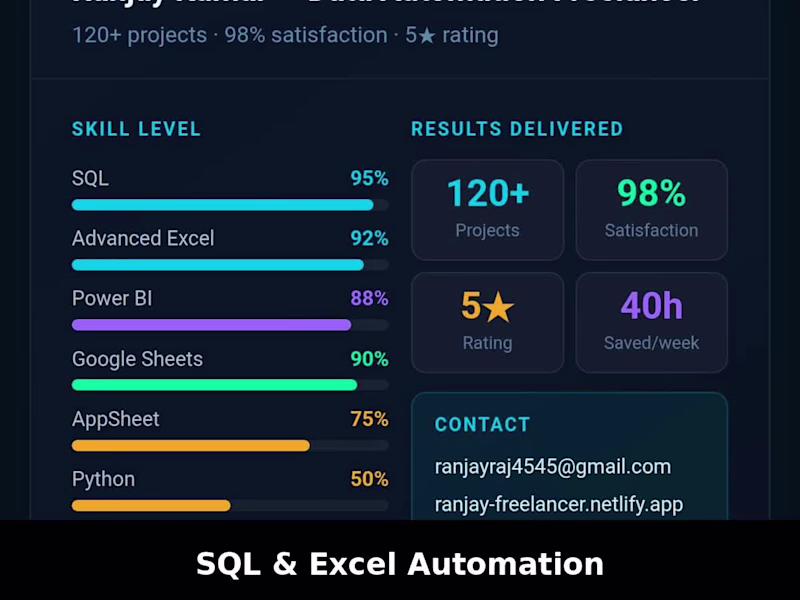
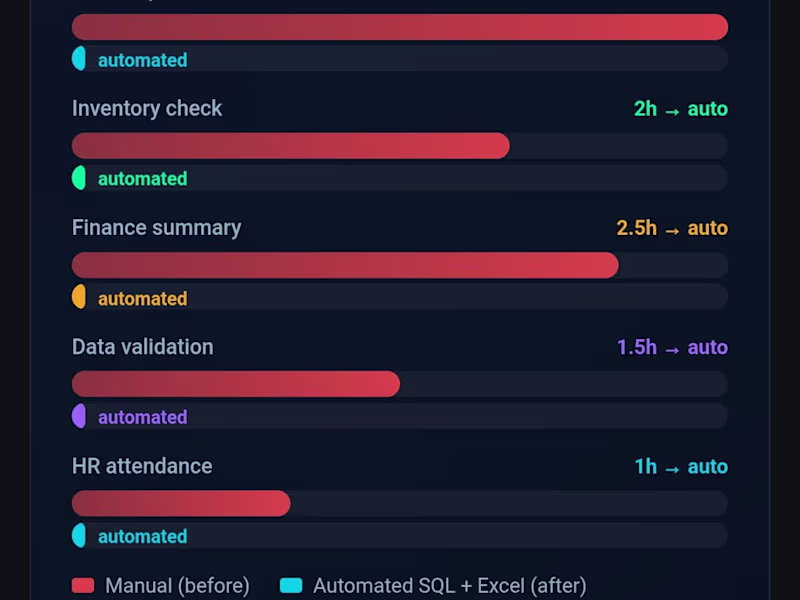
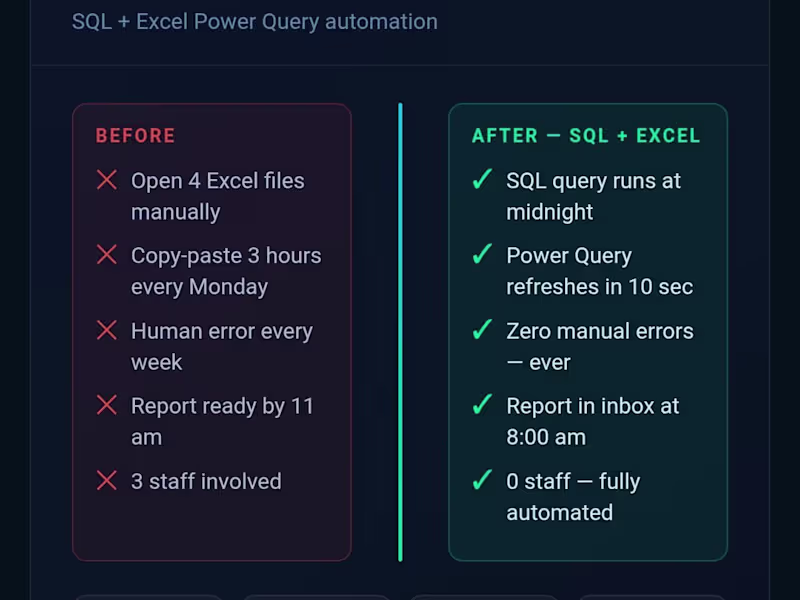
I automate processes and build dashboards that save time