The network for creativity
Join 1.25M professional creatives like you
Connect with clients, get discovered, and run your business 100% commission-free
Creatives on Contra have earned over $150M and we are just getting started
Back to feedPost

Executive Sales & Financial Performance Dashboard 📈💼
Developed a dynamic Executive Dashboard to monitor core financial health, sales performance, and cost distribution across various product categories.
Key Highlights:
Financial Metrics: Tracked real-time Total Profit ($482K), Total Revenue ($964K), and Total Cost ($964K).
Profit & Cost Analysis: Visualized profit distribution and cost trends across items like laptops, smartphones, and accessories.
Category Breakdown: Utilized treemaps and donut charts for clear revenue segmentation by category and region.
Designed to empower leadership with actionable insights for strategic decision-making and financial optimization.


The network for creativity
Join 1.25M professional creatives like you
Connect with clients, get discovered, and run your business 100% commission-free
Creatives on Contra have earned over $150M and we are just getting started
Related posts

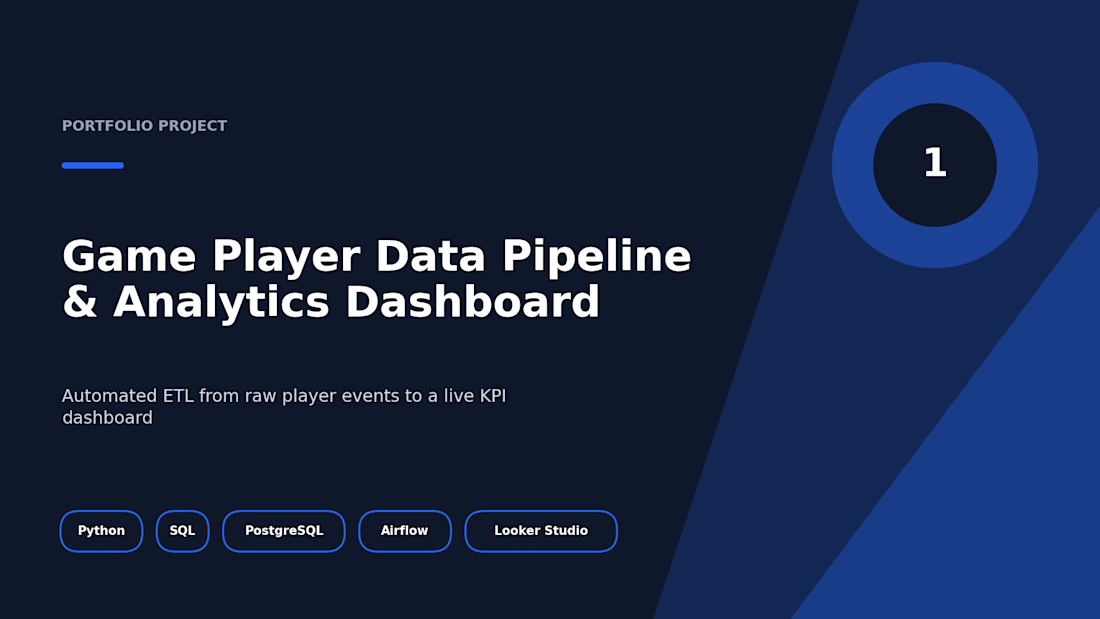
Game Player Data Pipeline and Dashboard




Great stuff! Would love to know what the brief looked like. You clearly took it somewhere special.


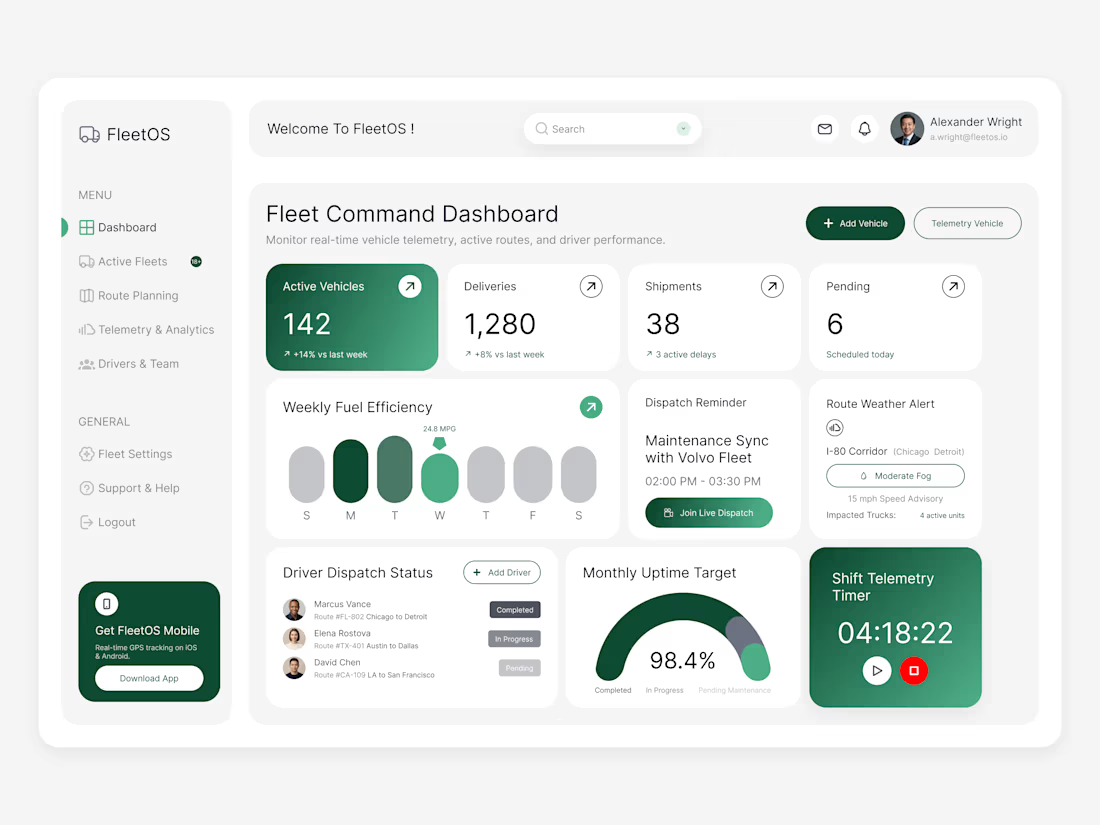

Clean dashboard!