The network for creativity
Join 1.25M professional creatives like you
Connect with clients, get discovered, and run your business 100% commission-free
Creatives on Contra have earned over $150M and we are just getting started
Back to feedPost
I will create professional Excel dashboards using your data to analyze sales, profit, performance, and trends. My dashboards are clean, easy to use, and designed for real business needs.
What I offer:
Excel dashboards with charts and visuals
Pivot tables and data analysis
Interactive slicers and filters
Sales, profit, and performance tracking
Clean and organized data layout
Why choose me:
Accurate and clear analysis
Fast delivery
Easy communication
Revisions until satisfaction (as per package)
Use cases:
Sales & revenue analysis
Business performance dashboards
Product & region-wise reports
Monthly or yearly reporting
Please message me before placing an order to discuss your data and requirements.

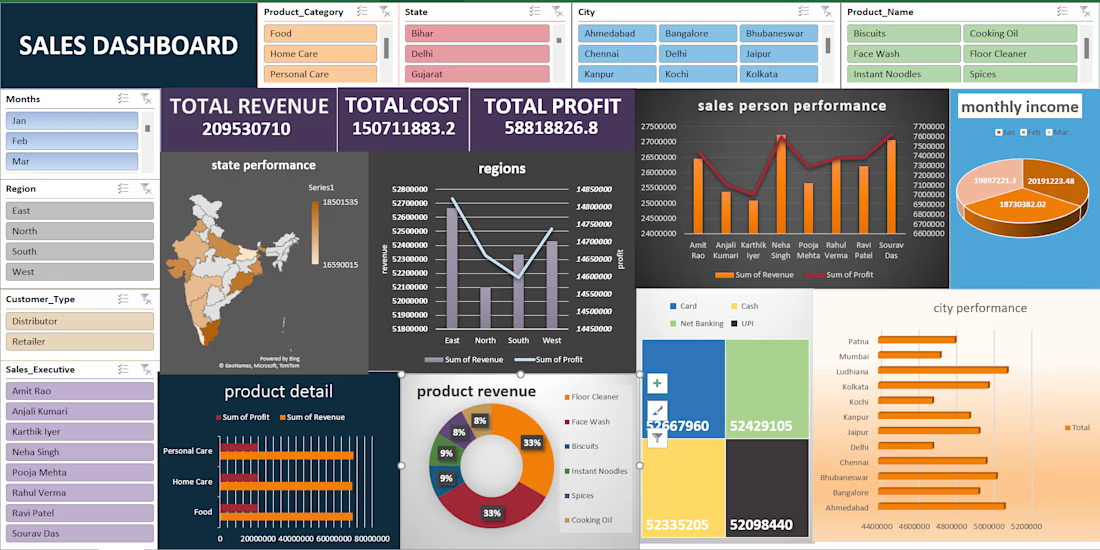
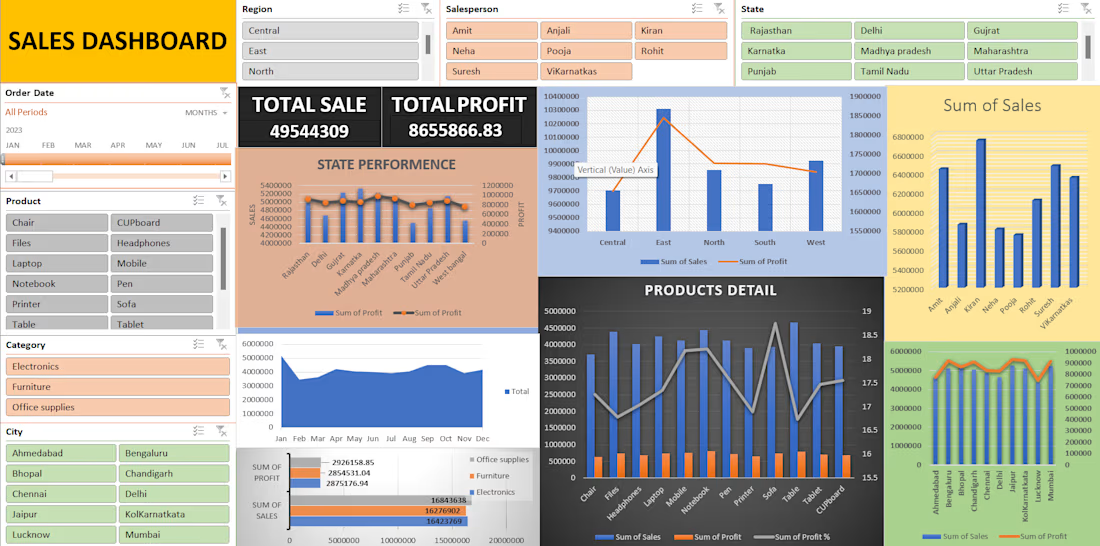

Clear and practical offering. Focusing on clean structure, interactive analysis, and business-ready dashboards is exactly what makes Excel effective for real decision-making. This kind of clarity is often more valuable than overly complex tools.

Thank you, Varghese — really appreciate your thoughtful feedback. My goal was exactly that: a clean, decision-ready dashboard that leadership can act on quickly.
That intent definitely comes through. When dashboards are designed to support quick, confident decisions, they tend to deliver far more value than visually heavy solutions. Great to see that focus reflected so clearly in the work.

Clean dashboards work best when the underlying data structure is solid. A lot of performance issues come from skipping that step.
The network for creativity
Join 1.25M professional creatives like you
Connect with clients, get discovered, and run your business 100% commission-free
Creatives on Contra have earned over $150M and we are just getting started
Related posts




Awesome dude

Business data often lives across payment, analytics, CRM, advertising, and inventory platforms. Metrik brings those signals together in one dashboard built for startups and small businesses.
See revenue, orders, customers, and business health at a glance. Compare advertising spend and ROAS across channels, explore visual KPI cards, and use smart alerts to spot unusual changes and potential risks.
The interface pairs a clean layout and rounded components with soft gradients, colorful analytics, and clear visual hierarchy, helping make business performance easier to follow.

Courtsy makes it easier to find and book sports courts from your phone. Explore nearby venues on a map, choose a sport, check court details and availability, then reserve a time slot.
The personal dashboard keeps upcoming bookings, spending, and savings in one place. A bold purple and yellow visual identity, expressive typography, and playful sports elements bring energy to the experience.