
How do you show a lot of data without overwhelming people?
When designing Vantage Admin, a performance dashboard for sales leaders, that was the main challenge. Leaders needed their own numbers, their team’s and their upper leaders’, all in one view.
So we kept it calm: a dark base, one purple accent for what matters, and clear sections for KPIs, trends, pipeline and team rankings. It works just as smoothly on mobile.
Clarity is what makes data useful.
0
17
Your portfolio gets visitors. But do you know how many almost booked a call?
We built an admin panel behind a designer portfolio that shows exactly that:
→ Who opened the booking window, who picked a time, who actually booked
→ Drag to reorder projects, toggle what shows on the homepage
→ Edit hero, CTA, pricing and footer without touching code
→ Visitors, button clicks and conversion rate in one place
A portfolio should work like a sales tool, not a gallery. (Demo data in the video.) Would you want this for your own site?
2
31
Ever opened a dashboard and had no idea where to look first?
I designed Loopo a financial analytics dashboard concept around one question: what does the user need to see first? The result is a clear hierarchy, charts that read at a glance and a clean layout that gives the numbers room to breathe.
Watch the walkthrough and tell me what stands out to you first.
I’m open to new SaaS and dashboard design projects. If your users struggle to find what matters in your product, send me a message here and let’s talk.
0
16
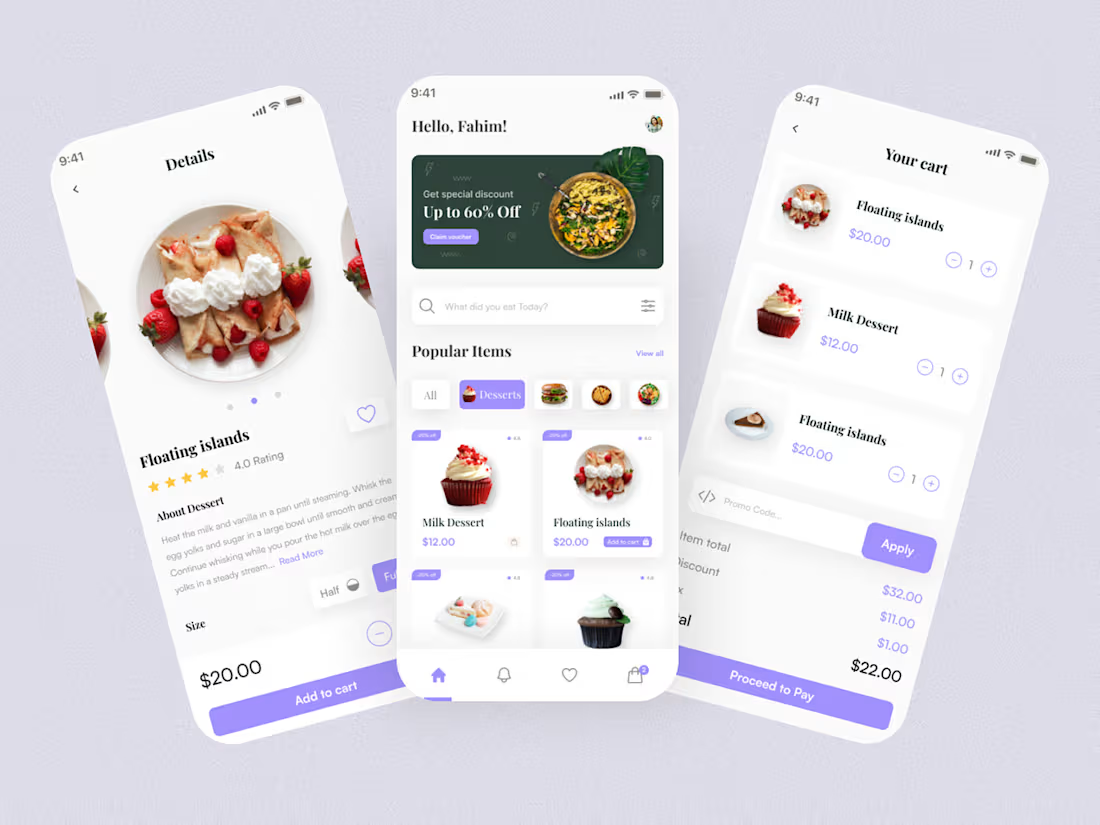
Food Delivery app design on Behance
0
6