Transforming Data into Actionable Insights 🔍
Transforming Data into Actionable Insights 🔍
A senior full-stack developer and AI/ML specialist
A senior full-stack developer and AI/ML specialist


Skilled data entry expert delivering accurate and organized
Skilled data entry expert delivering accurate and organized
View more →
Expert Data Analyst specializing in Excel & SQL
Expert Data Analyst specializing in Excel & SQL

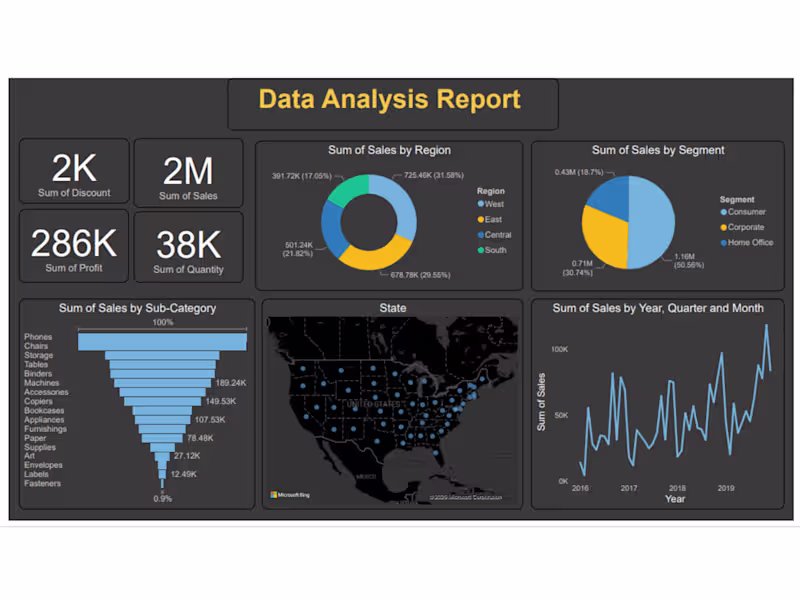
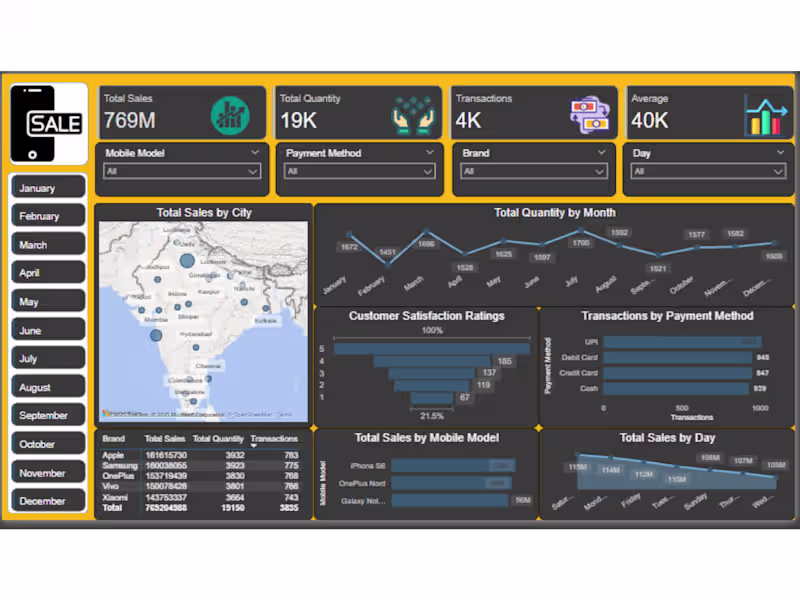
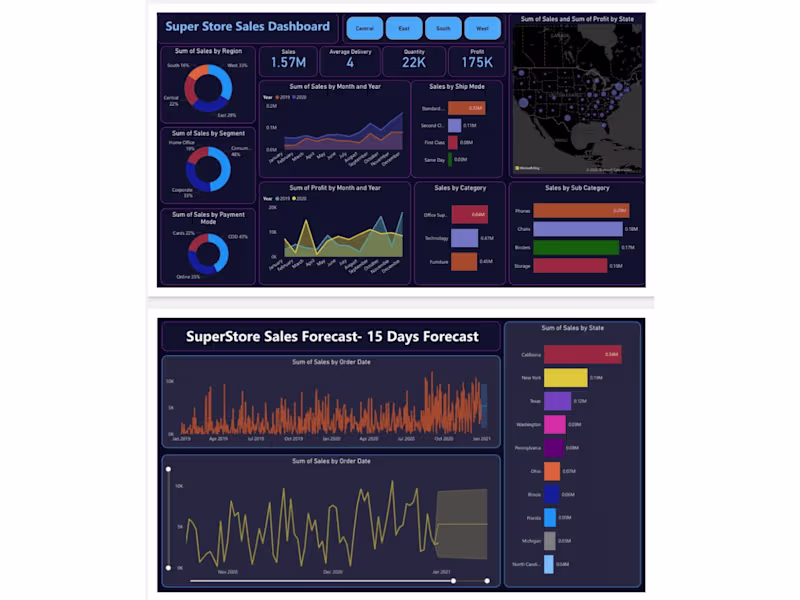
Data Analyst | Power BI Developer | Excel, SQL, Python
Data Analyst | Power BI Developer | Excel, SQL, Python
UX, Optimizing Operations & Virtual Assistance
UX, Optimizing Operations & Virtual Assistance


View more →
Data Engineer | Data Scientist
Data Engineer | Data Scientist
View more →
Software development and precise data management.