
Data visualization engineer, Data Analyst, BI Expert
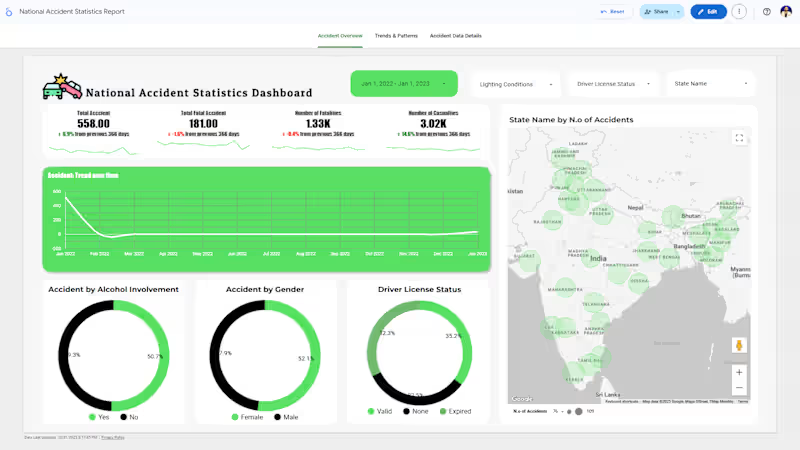
National Accident Statistics Dashboard in Google Looker Studio:
I built an interactive Looker Studio dashboard using Google Sheets as the data source to visualize national accident statistics. The report analyzes accidents by region, time, severity, and demographics. A scheduled data re:fresh every 15 minutes keeps the dashboard updated in real time. As a Data Visualization Expert, I combined automation and design to deliver a clean, insightful, and dynamic Looker Studio dashboard for data-driven decision-making.
🎉 💯 🎉
2
198


AI Apps Developer | AI SaaS, Voice AI, n8n, Automation, APIs

MongoDB Atlas Data Management & Interactive Dashboard
Project Overview😍
- The project focuses on leveraging MongoDB Atlas for efficient data storage, management, processing, and visualization through interactive dashboards. The solution enables organizations to manage structured and unstructured data, monitor business operations, and transform raw information into meaningful insights through real-time data access and analytics.
Project Requirements:
1. Configure and manage cloud-based databases using MongoDB Atlas.
2. Design efficient database schemas and collections for business data.
3. Implement CRUD operations for seamless data management.
4. Develop secure database connectivity using APIs and backend applications.
5. Perform data aggregation, filtering, querying, and transformation.
6. Build interactive dashboards to visualize business metrics and KPIs.
7. Enable real-time or near-real-time data monitoring and reporting where supported.
8. Implement database indexing and query optimization for better performance.
9. Integrate MongoDB Atlas with analytics tools and application workflows.
10. Ensure data security, access control, backup, and scalability.
Overall Business Impact:
- The combination of MongoDB Atlas, data analytics, and interactive dashboards creates a scalable data management ecosystem that improves data accessibility, operational visibility, reporting efficiency, and strategic decision-making.
#Blackcoffer #MongoDB #MongoDBAtlas #DatabaseManagement #DataAnalytics #DataVisualization #InteractiveDashboard #BusinessIntelligence #DashboardDevelopment #CloudDatabase #NoSQL #BigData #DataEngineering #DataManagement #RealTimeAnalytics #DataDriven #CloudComputing #DigitalTransformation #DataInsights #TechnologyInnovation
0
25
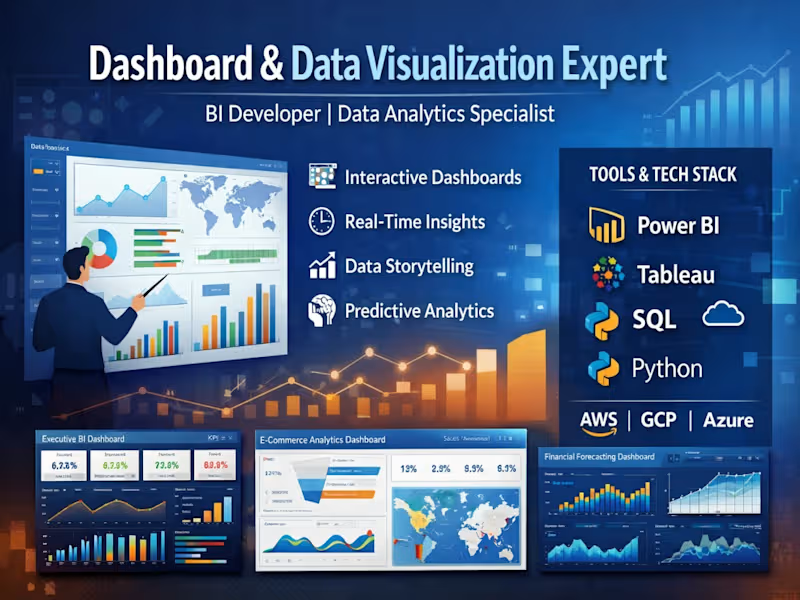
I specialize in transforming complex datasets into intuitive, visually compelling dashboards that drive strategic decision-making. With deep expertise in BI tools and data analytics, I design interactive, real-time reporting systems that help businesses uncover trends, monitor KPIs, and optimize performance. My approach combines data storytelling, clean UI/UX, and scalable architecture to deliver impactful insights.
🔹 My Project Portfolio:
📊 1. Executive Business Intelligence Dashboard
Built a dynamic KPI dashboard for C-level executives
Integrated multiple data sources (CRM, ERP, marketing platforms)
Delivered real-time insights on revenue, growth, and performance
Tools: Power BI, SQL, Azure
📈 2. E-commerce Analytics Dashboard
Designed a dashboard tracking sales, customer behavior, and conversion rates
Implemented cohort analysis and funnel visualization
Improved marketing ROI tracking by 40%
Tools: Tableau, Python, Google Analytics
📉 3. Financial Performance & Forecasting Dashboard
Developed financial models and forecasting dashboards
Visualized cash flow, P&L, and budget vs actuals
Enabled data-driven financial planning
Tools: Power BI, Excel, DAX
📍 4. Operations & Supply Chain Dashboard
Created logistics tracking and inventory monitoring system
Real-time alerts for stock levels and delays
Reduced operational inefficiencies
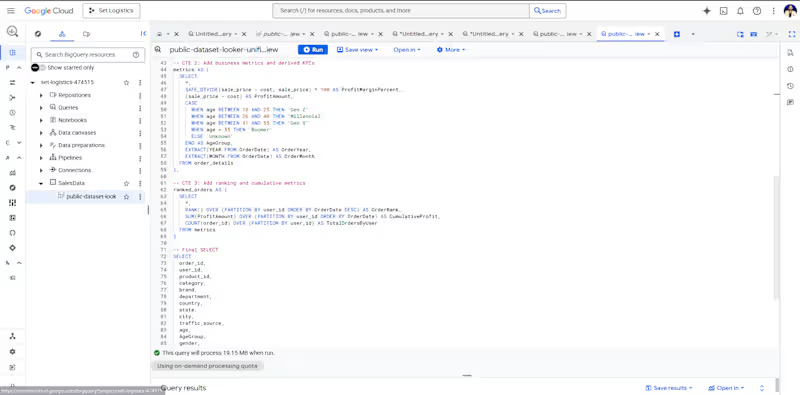
Tools: Looker Studio, BigQuery
📊 5. AI-Powered Analytics Dashboard
Integrated machine learning predictions into dashboards
Automated anomaly detection and trend analysis
Delivered predictive insights for decision-making
Tools: Python, TensorFlow, Streamlit
1
2
235
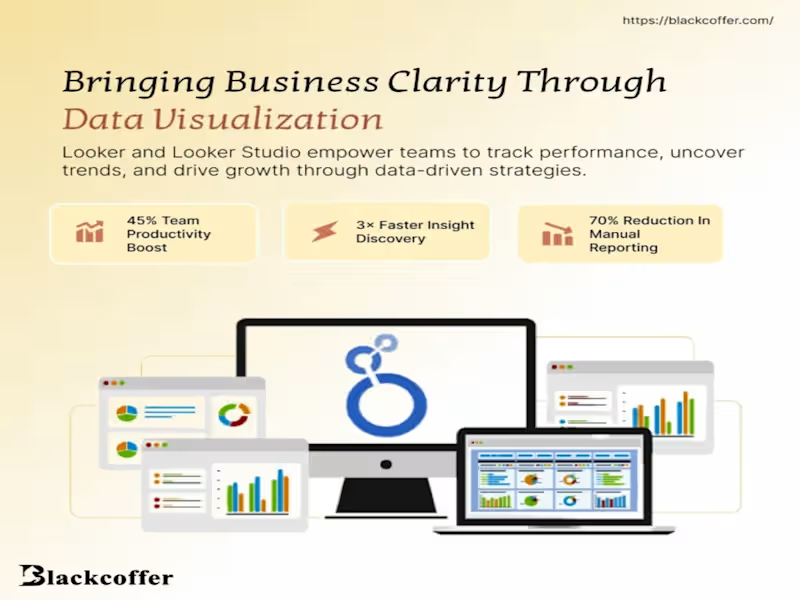
I work with data analytics and machine learning to extract insights and build intelligent solutions. I design and develop interactive dashboards and data visualizations that make complex data easy to understand and act on.
1
259
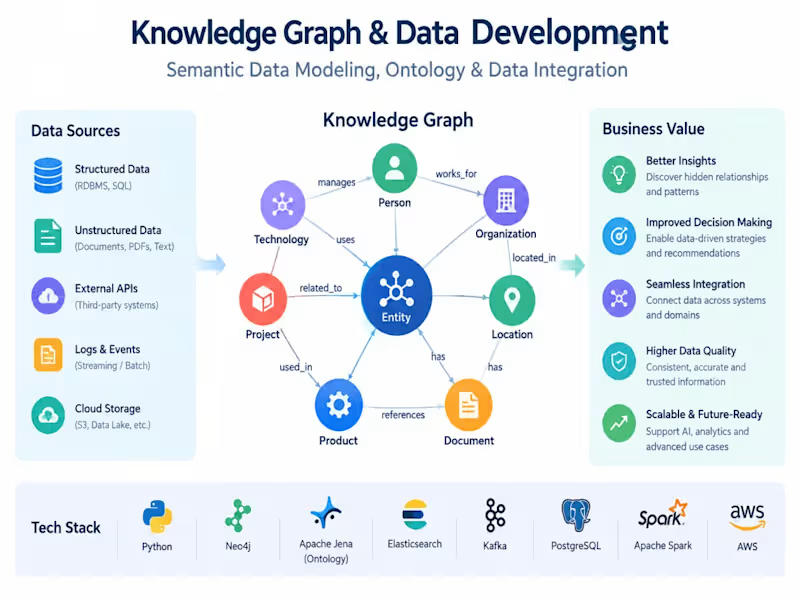
The project focuses on automating vehicle insurance certificate workflows using a scalable microservices architecture. The solution streamlines insurance certificate processing by reducing manual intervention, improving data handling, and enabling seamless communication between services through APIs and system integrations.
The architecture is designed to support efficient workflow execution, reliable data exchange, and scalability as transaction volumes increase. By modernizing insurance operations, the solution helps create a more consistent, maintainable, and efficient process for managing vehicle insurance certificates.
Business Impact
1. Increased Operational Efficiency: Reduced repetitive manual tasks and streamlined certificate processing workflows.
2. Faster Processing: Improved workflow execution to support quicker handling of insurance certificate requests.
3. Scalability: Enabled independent services to scale as business demand and transaction volumes grow.
4. Improved Reliability: Supported better service isolation and maintainability through a modular microservices architecture.
5. Reduced Operational Overhead: Helped minimize manual effort and workflow complexity.
6. Enhanced Integration: Enabled smoother communication between systems through APIs and service-to-service interactions.
7. Business Growth Readiness: Established a flexible foundation for future automation, integrations, and enhancements.
Overall Outcome
The project demonstrates how workflow automation and scalable microservices can modernize vehicle insurance operations, improve process efficiency, and provide a flexible technical foundation for future business growth.
0
47

Business Automation | Power BI, Excel & AI Workflows

Transforming data into insights that drive growth with AI
Transforming data into insights that drive growth with AI
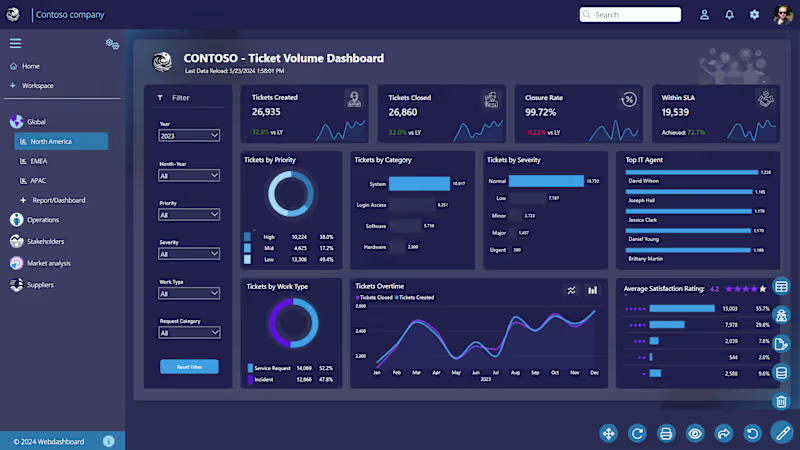
IT Service Management Dashboard Project
Developed an interactive IT Service Management dashboard to monitor ticket volume, incident trends, SLA performance, and support team efficiency. Analyzed operational support data to identify service bottlenecks, improve response times, and support data-driven operational decisions.
Key Business Insights & Decisions:
Monitored ticket creation and closure trends to improve operational efficiency
Identified high-priority and high-severity incidents requiring immediate attention
Tracked SLA compliance rates to reduce delayed ticket resolutions
Analyzed support categories and work types to optimize resource allocation
Evaluated top-performing IT agents based on ticket resolution performance
Improved service quality monitoring through customer satisfaction analysis
Dashboard Highlights:
Ticket Volume & Closure Tracking
SLA Performance Monitoring
Ticket Priority & Severity Analysis
Support Category Breakdown
IT Agent Performance Analysis
Customer Satisfaction Metrics
Interactive Filters for Dynamic Reporting
Skills Used:
Data Cleaning & Transformation
Exploratory Data Analysis (EDA)
KPI Monitoring & Reporting
Operational Data Analysis
Data Visualization
Dashboard Development
Business Intelligence Reporting
Insight-Driven Decision Making
Tools & Technologies:
Power BI • Excel • SQL • Python • DAX • Data Visualization
0
35
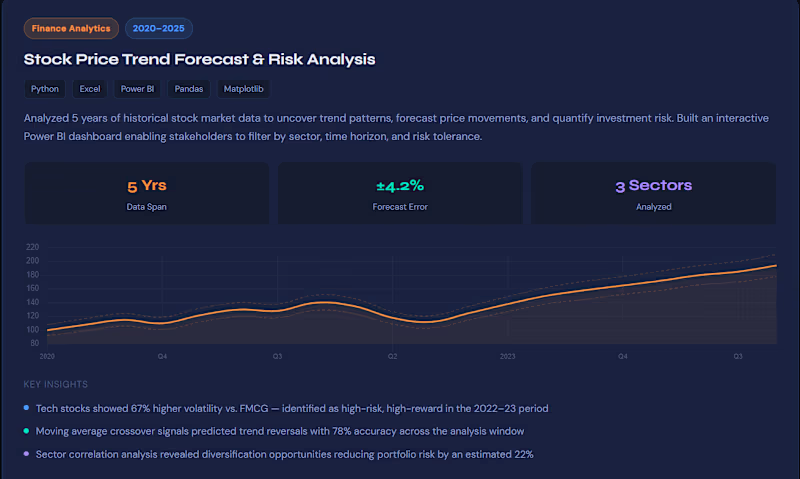
Tesla Sales & Market Analysis Project
Conducted a data-driven analysis of Tesla’s sales performance, market trends, and customer demand patterns using real-world datasets. Cleaned and analyzed large datasets to identify revenue trends, regional performance, and key business insights that could support strategic decision-making.
Key Business Insights & Decisions:
Identified top-performing sales regions and revenue-driving markets
Analyzed customer demand trends to understand purchasing behavior
Detected seasonal sales patterns to support forecasting strategies
Helped highlight opportunities for improving sales performance and market targeting
Built interactive dashboards for easy tracking of KPIs and business metrics
Skills Used:
Data Cleaning & Preprocessing
Exploratory Data Analysis (EDA)
Sales Trend Analysis
Data Visualization
Dashboard Development
Business Intelligence Reporting
KPI Analysis
Business Insight Generation
Tools & Technologies:
Excel • Python • SQL • Power BI • Pandas • Matplotlib
0
47
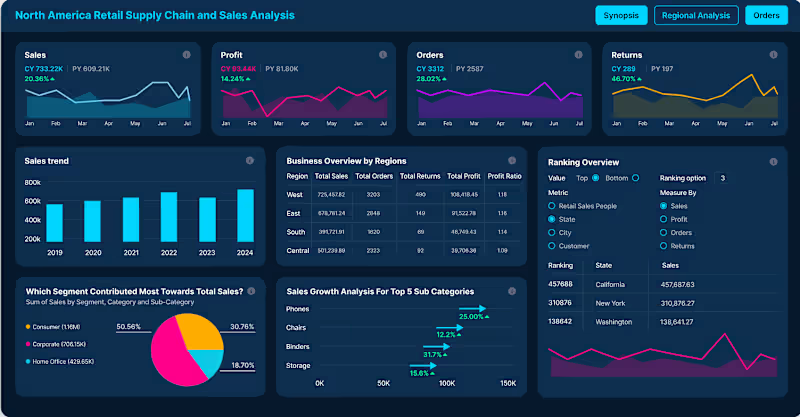
Sales Analysis Dashboard Project
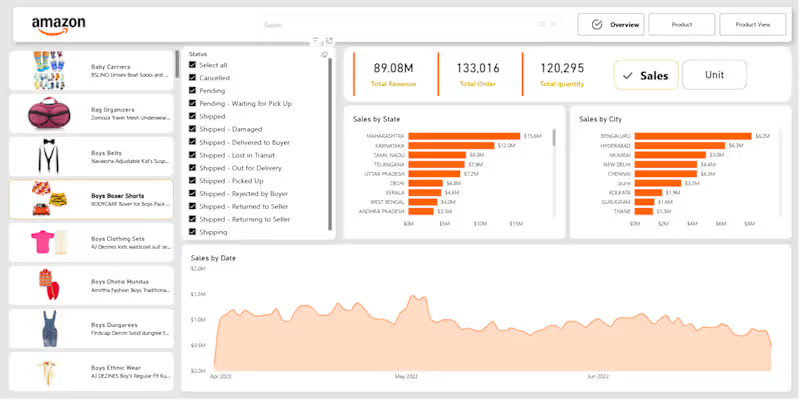
Built an interactive Sales Analysis dashboard to track revenue, sales trends, product performance, and customer purchasing behavior. Analyzed sales data to identify growth opportunities and support data-driven business decisions.
Key Insights:
Identified top-performing products and sales regions
Analyzed monthly sales trends and customer buying patterns
Tracked KPIs to improve sales performance and forecasting
Skills Used:
Data Analysis • KPI Reporting • Data Visualization • Dashboard Development • Business Intelligence
Tools:
Power BI • Excel • SQL • Python
0
32
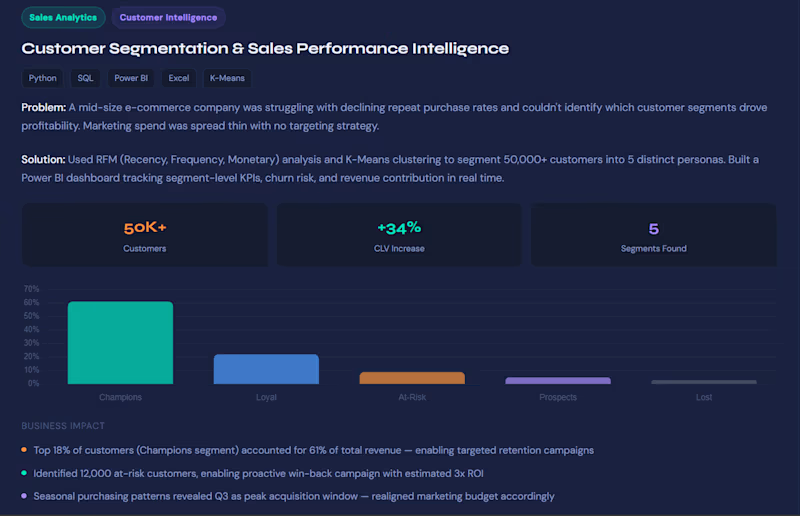
Customer Segmentation Case Study
Analyzed customer purchasing behavior using data analysis techniques to identify high-value customer segments and buying patterns. Cleaned and processed raw customer data using Excel and Python, then created interactive dashboards in Power BI to visualize customer demographics, spending habits, and retention trends.
Key Business Improvements & Decisions:
Identified the most profitable customer groups for targeted marketing
Helped optimize marketing campaigns based on customer behavior
Suggested personalized offers for high-value customers to improve retention
Reduced unnecessary marketing spend by focusing on the right audience segments
Improved decision-making through clear KPI dashboards and customer insights
Tools Used:
Excel • Python • SQL • Power BI
0
44

Data Insights & Dashboards Curated for Success
Data Insights & Dashboards Curated for Success



View more →

I automate processes and build dashboards that save time

5 signs your business needs automation:
1️⃣ You copy-paste data between files daily
2️⃣ Your reports take more than 30 minutes to prepare
3️⃣ You've found errors in your spreadsheets more than once
4️⃣ You don't know your real-time sales or inventory right now
5️⃣ Your team does the same task more than 3 times a week
If you said yes to even 2 of these —
you're losing money to manual work.
I fix this using:
→ SQL (connects and cleans your data)
→ Advanced Excel (automates your reports)
→ Power BI (shows everything in real time)
→ AppSheet (gives your team a mobile app)
→ Google Sheets (collaborates automatically)
Starting from $69. No long contracts.
Check my profile 👇
#businessautomation #dataanalyst #powerbi
#excel #sql #freelancer #nocode #contra
1
117
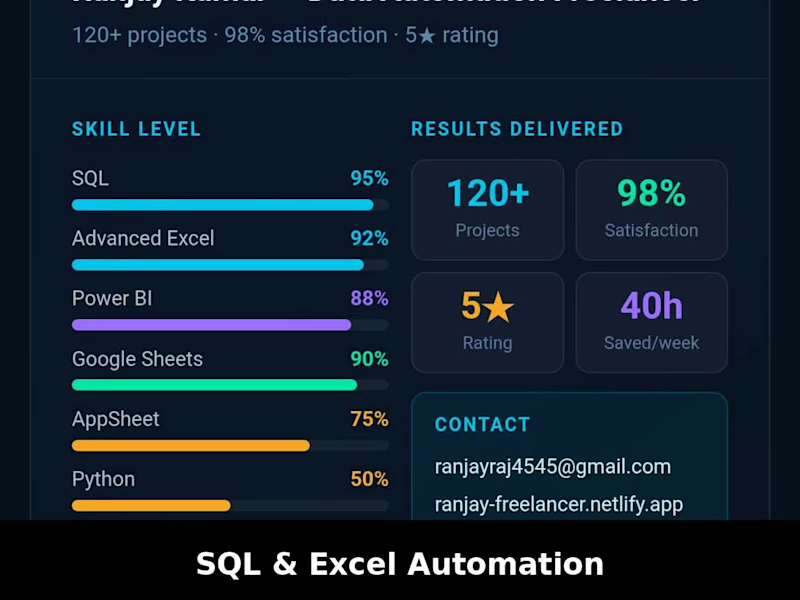
I automated a business workflow using SQL + Excel by connecting multiple Excel files into one system, creating automated data refreshes, building a live dashboard, and scheduling automatic reports — eliminating manual work and saving hours every week.
1
131


Data Analyst | SQL & Power BI Specialist
Data Analyst | SQL & Power BI Specialist
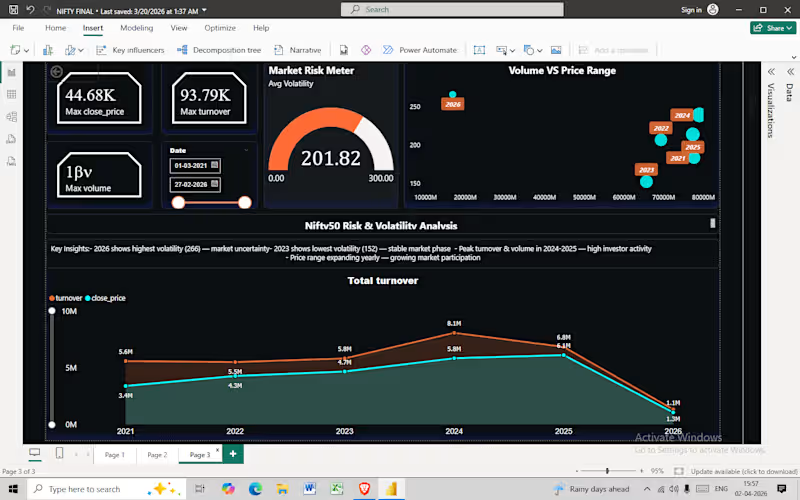

Developed a comprehensive Stock Market Analysis tool using SQL and Power BI to visualize Nifty 50 data.
Data Processing: Cleaned and transformed raw financial datasets using Excel and SQL queries.
Interactive Visuals: Built 3 dynamic dashboards tracking price trends, volatility, and sectoral rotations.
Business Insights: Identified key market drivers and risk factors through historical data analysis.
Financial Expertise: Proven experience in stock market data analysis (Nifty 50).
Tech Stack: Power BI, SQL, Microsoft Excel.
3
149


In this technical deep-dive, I engineered a robust SQL script to extract high-level financial insights from 20+ years of Nifty 50 data. I moved beyond basic queries to implement complex analytical functions that simulate real-world market tracking.
Market Sentiment Logic: Developed a CASE-based classifier to identify Bullish/Bearish trends using 50-day Moving Averages.
Volatility & Risk: Calculated day-on-day price fluctuations and ranked high-risk trading days.
Momentum Tracking: Integrated window functions (LAG/LEAD) to compute RSI-base logic and 30-day price momentum.
Efficiency Metrics: Analyzed Turnover Efficiency to understand market liquidity during peak trading hours.
This project demonstrates my ability to handle large-scale financial datasets and translate raw numbers into strategic market indicators.
1
92

Business Intelligence Specialist | Power BI & Excel Expert
Business Intelligence Specialist | Power BI & Excel Expert
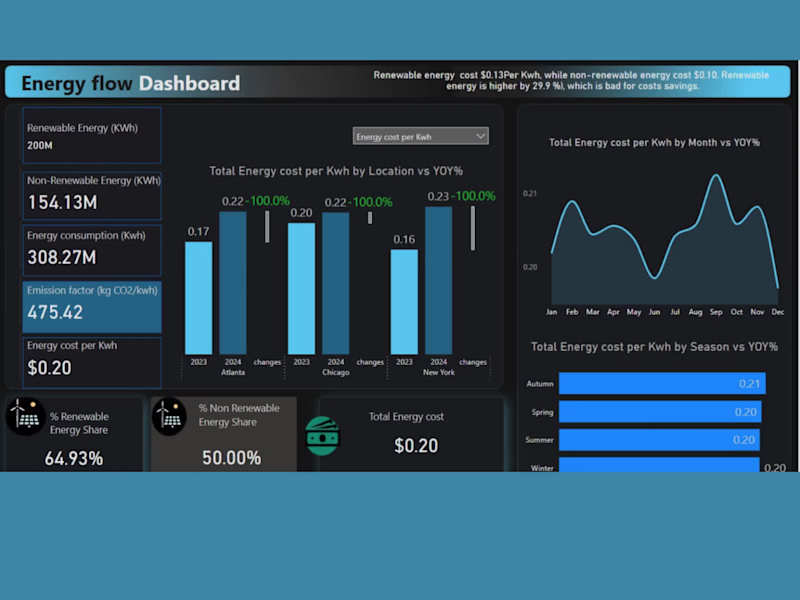
⚡ Energy Flow Analysis Dashboard – Power BI Project
This interactive Power BI dashboard provides a comprehensive view of energy generation, consumption, and efficiency across multiple sources and regions. Designed to help energy companies and policymakers make data-driven decisions, it visualizes how energy moves through different stages — from production to end usage.
🔍 Key Insights & Features:
Detailed breakdown of energy input, output, and loss percentages.
Interactive visuals to track renewable vs. non-renewable energy usage.
KPIs highlighting total energy generated, consumed, and saved.
Trend charts showing performance over time and by location.
This project demonstrates my ability to transform complex energy data into clear, actionable insights using Power BI.
0
88
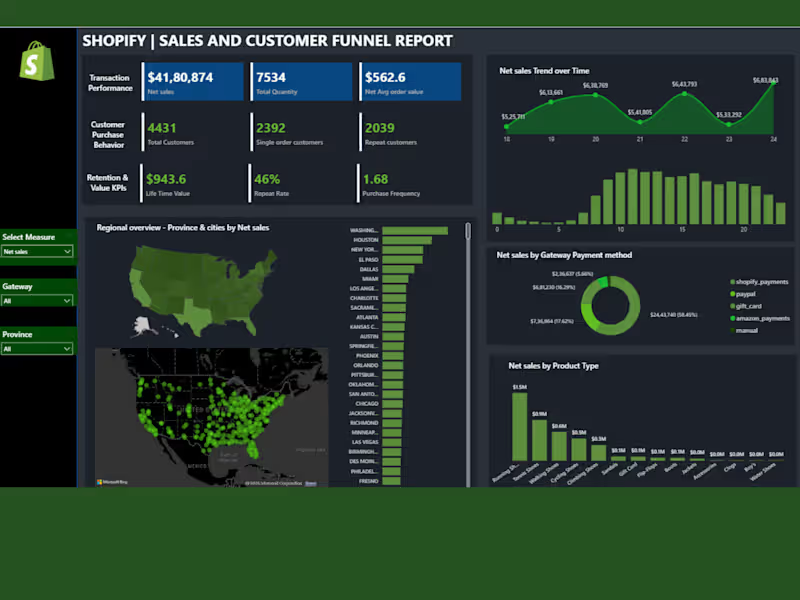
🛍️ Shopify Sales & Customer Funnel Dashboard (Power BI Project)
I designed this interactive Shopify Sales & Customer Funnel Dashboard in Microsoft Power BI to help e-commerce store owners gain deep insights into their sales, customer behavior, and performance trends. The dashboard converts raw Shopify data into a clear visual story that supports smarter, data-driven decisions.
Thanks!
0
79
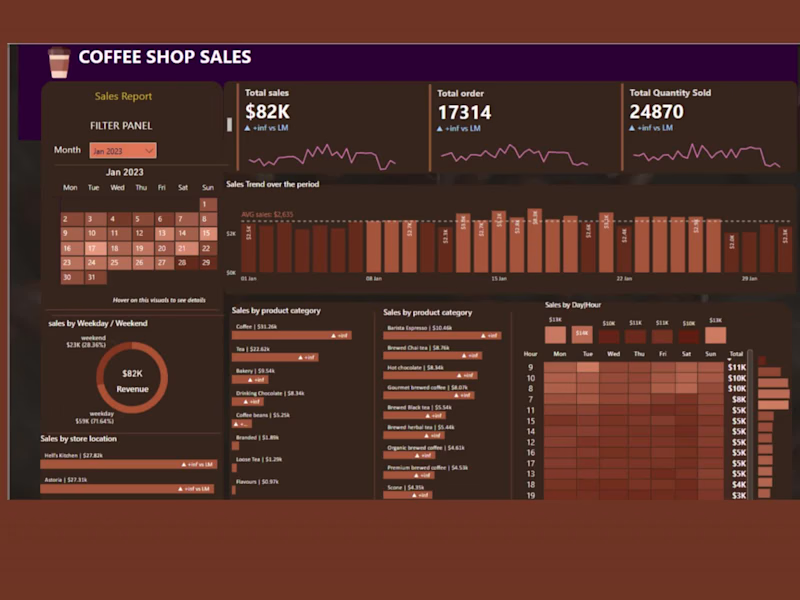
☕ Coffee Shop Sales Dashboard – Power BI Project
This interactive Power BI dashboard offers a complete view of coffee shop performance through advanced sales analytics. It tracks key metrics like Total Sales, Orders, and Quantity Sold while analyzing performance by Product Category, Store Location, and Day/Hour. With insights on weekday vs weekend trends, customer behavior, and revenue drivers, it empowers owners to make data-driven decisions, optimize operations, and boost profitability using dynamic and engaging visuals.
0
129