Management Reporting & Dashboard Design

Praveen Rana

Management Reporting & Dashboard Design
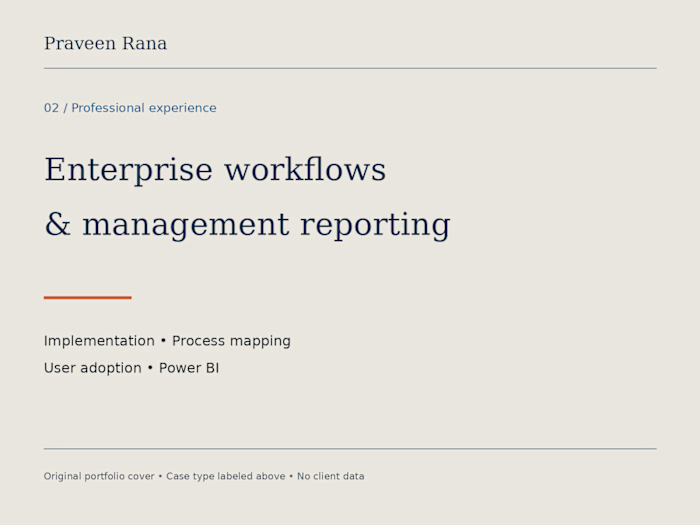
Synthetic dashboard demonstration informed by genuine professional Power BI experience. This interactive example is HTML and JavaScript, not a Power BI export or client work.
Problem: management needs clear KPIs, consistent filters and figures that agree with source records.
The example uses a fictional distributor, three regions and six months. Revenue, budget, margin, commentary and ledger comparison follow the same filter. A visible measure dictionary includes DAX definitions for reference; charts also offer tables.
My contribution: reporting requirements, model structure, KPI definitions and AI-assisted development with calculation checks. Professional Power BI management reporting is part of my employment background; confidential enterprise reports are not reproduced.
What this proves: business-focused report design, traceable definitions and validation. It does not prove a live Power BI Service deployment.
Like this project
Posted Oct 23, 2026
Interactive HTML dashboard with fictional data, defined KPIs and a ledger tie-out. Informed by professional Power BI experience; not a Power BI export.
Likes
0
Views
0