Delivering Strategic Growth Through Data, Finance & Tech.
Statistician and Data Analyst Expert
Statistician and Data Analyst Expert


View more →
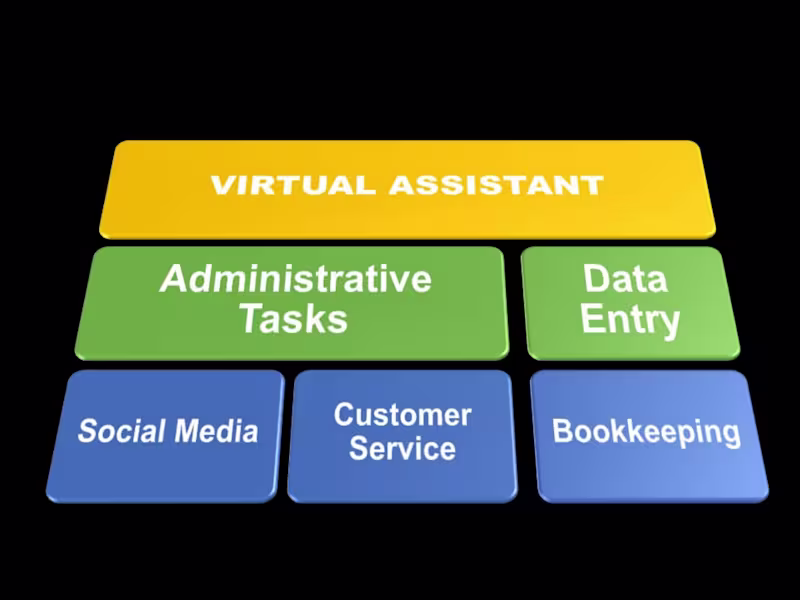
Customer Success Expert & Virtual Admin Guru
Customer Success Expert & Virtual Admin Guru


View more →
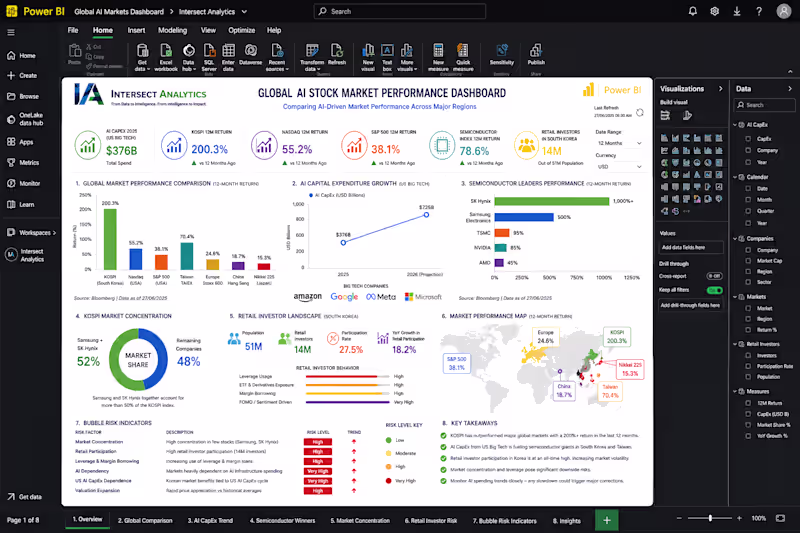
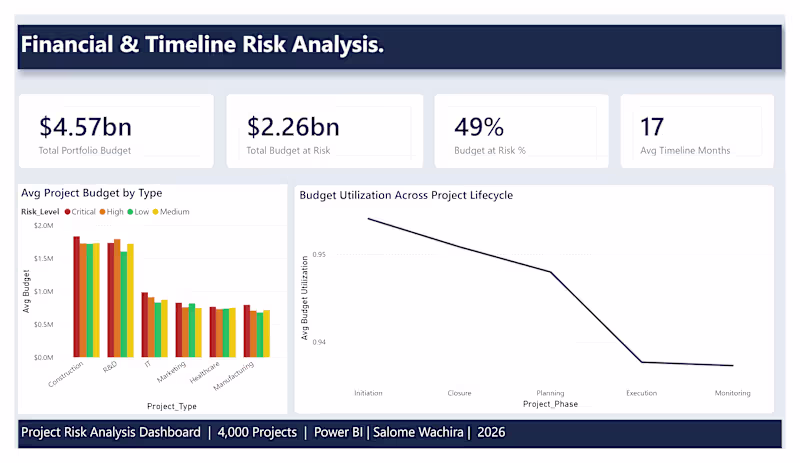
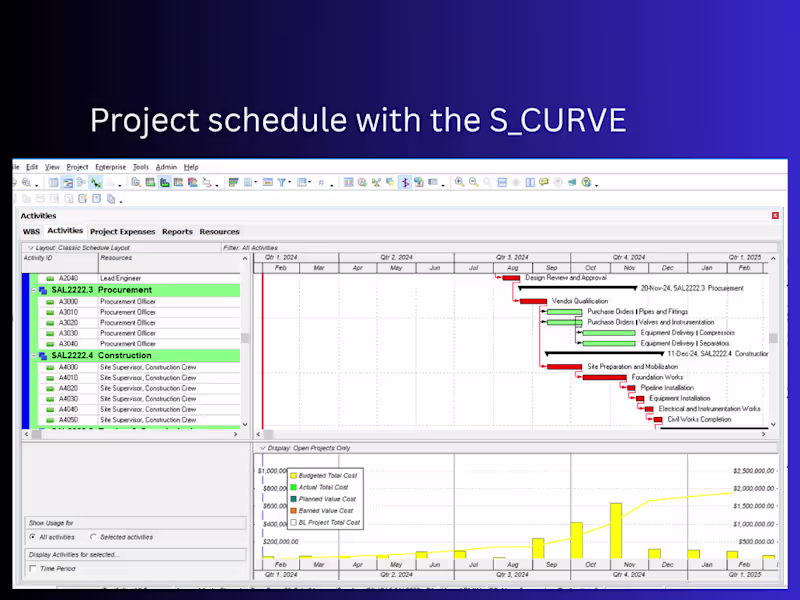
Project Scheduling |Primavera P6 | MS Project, Power BI
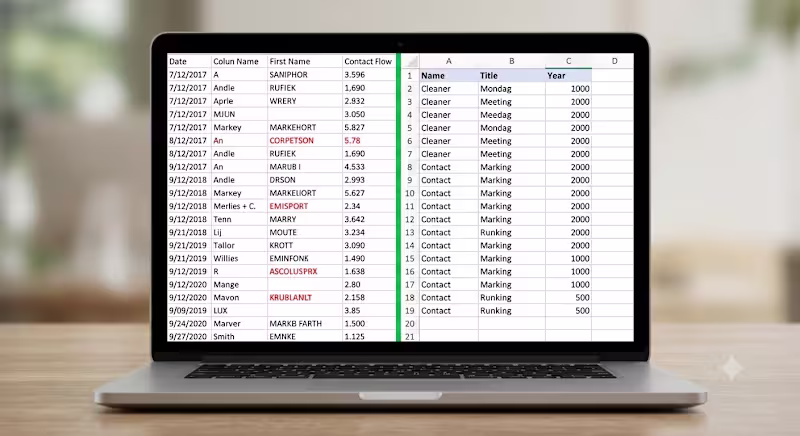
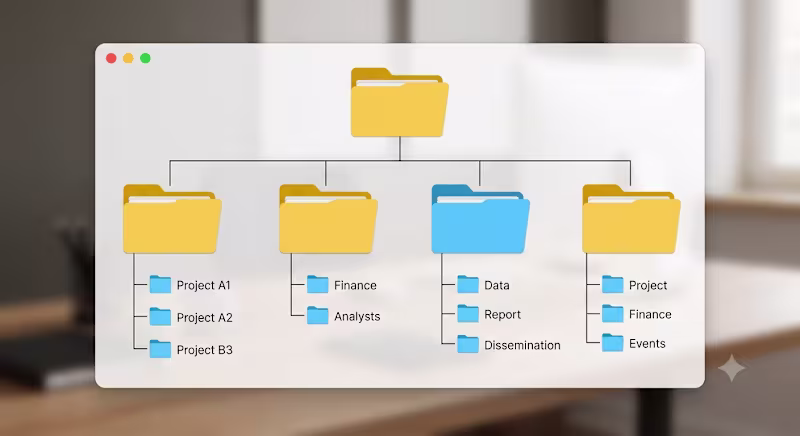
I transform disorganized data and messy cloud drives

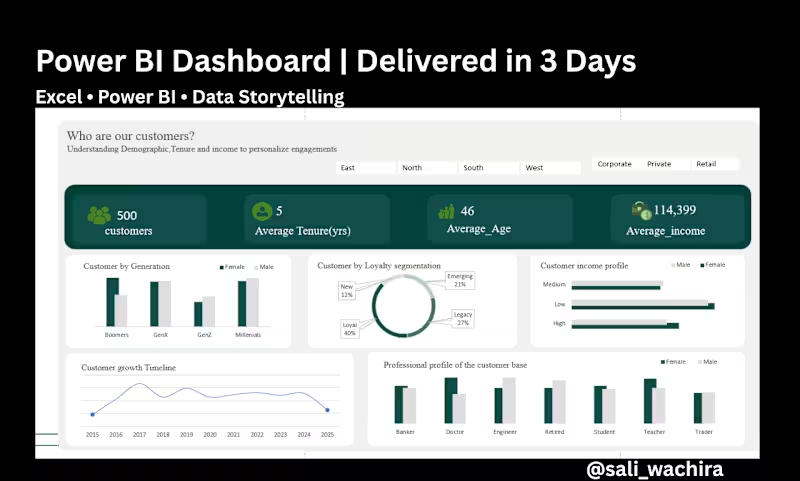
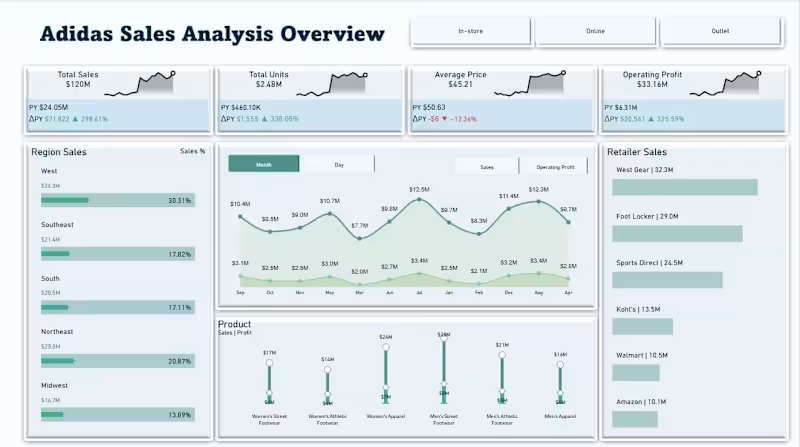
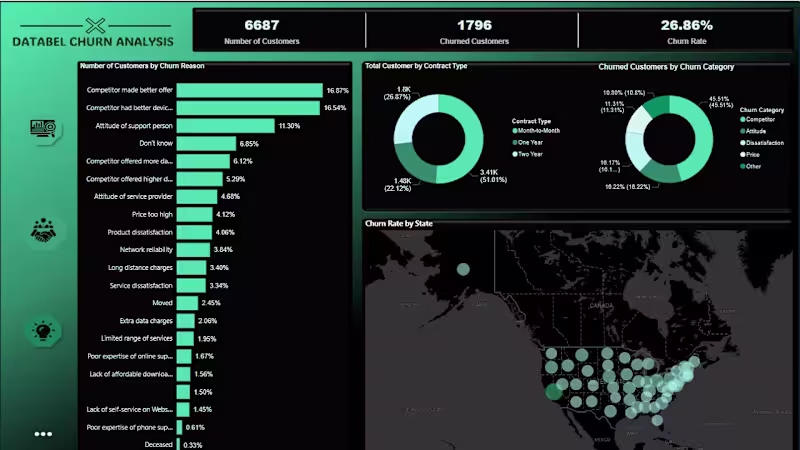
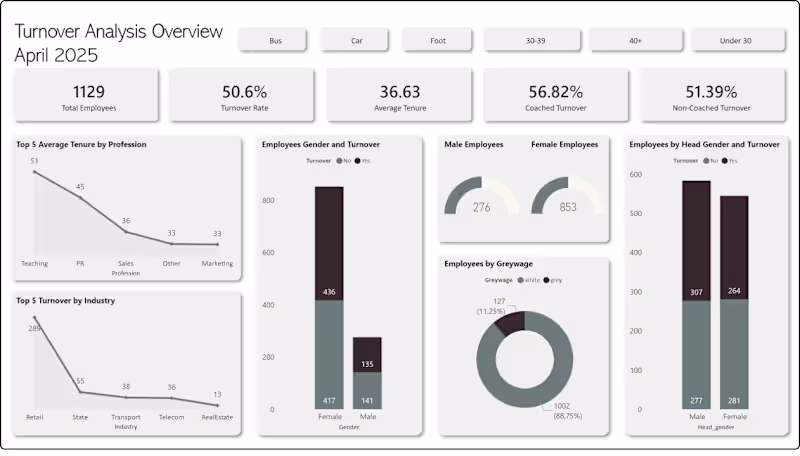
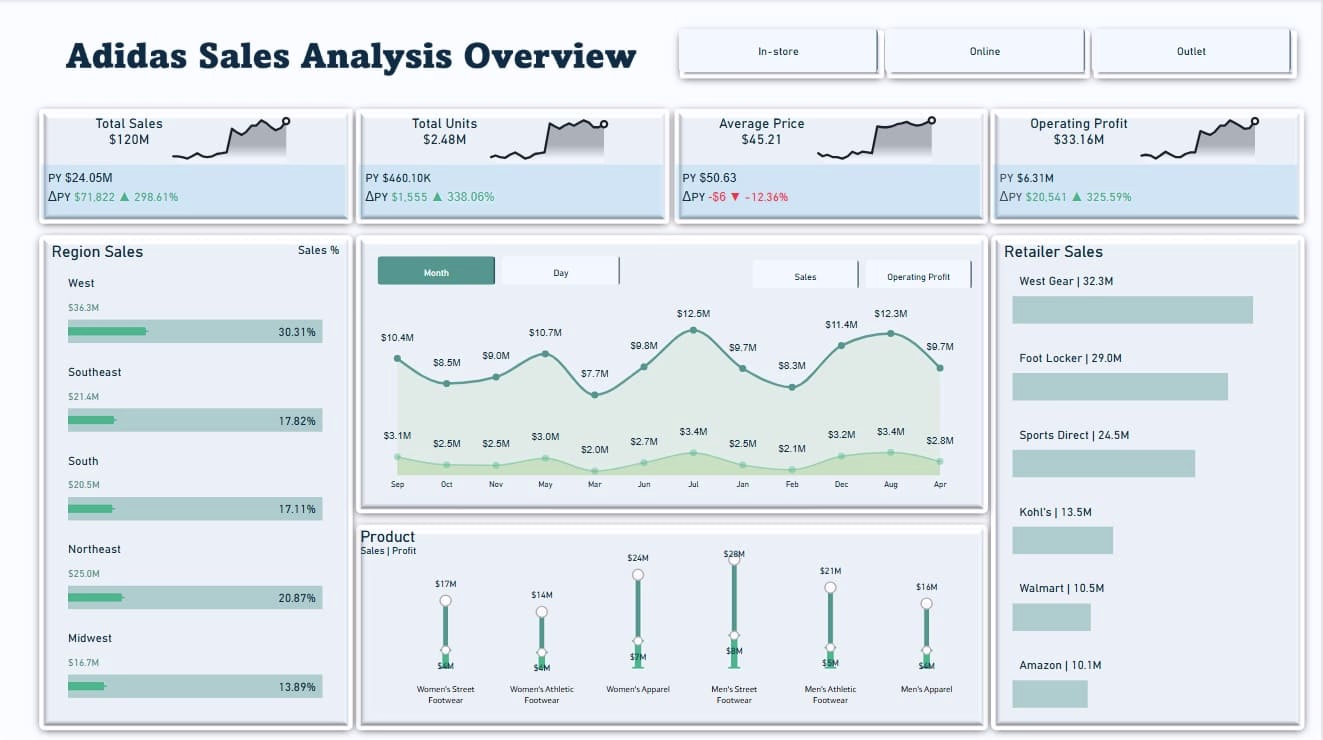
Decoding data patterns to reveal actionable business stories
Decoding data patterns to reveal actionable business stories
View more →
Exceeding Expectations in Youtube Growth & Data Analysis
Exceeding Expectations in Youtube Growth & Data Analysis


View more →
Technical Writer for EdTech & Cybersecurity Startups
Technical Writer for EdTech & Cybersecurity Startups