Turnover Analysis Dashboard
Elizabeth Waweru
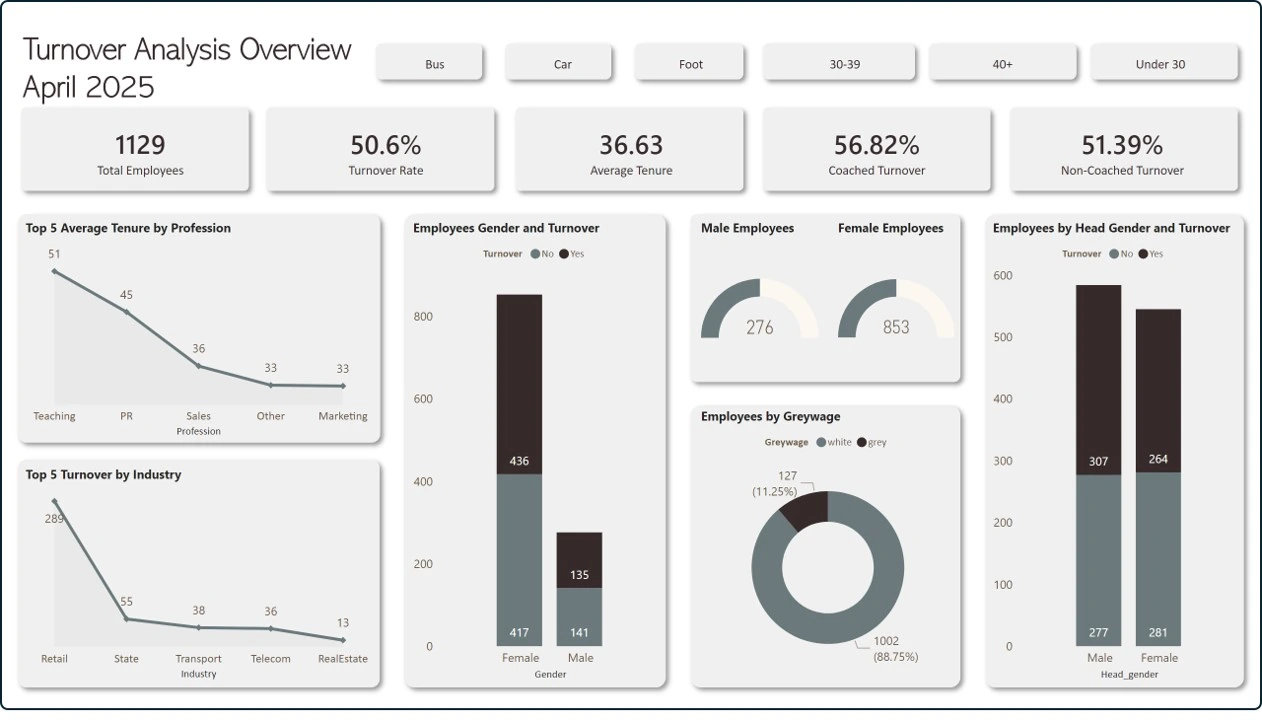
📉 Turnover Analysis Dashboard – April 2025
A Power BI dashboard that provides a deep dive into employee turnover patterns using real-world HR data. The dashboard helps uncover trends in employee tenure, industry attrition, coaching influence, and gender-based turnover to support better decision-making in HR strategy.
🔗 Live Dashboard: Click to View
📌 Table of Contents
🧠 Overview
This HR analytics dashboard explores trends and patterns related to employee turnover. The visualizations help HR professionals and business leaders understand key drivers of attrition across age, gender, industry, and coaching status.
The dashboard was built using Microsoft Power BI and incorporates interactive filtering and storytelling elements for a smooth user experience.
🔍 Key Insights
Total Employees: 1,129
Turnover Rate: 50.6%
Average Tenure: 36.63 months
Coached Turnover: 56.82%
Non-Coached Turnover: 51.39%
🧑🤝🧑 Gender Turnover Breakdown
Females: 436 of 853 left (higher attrition)
Males: 135 of 276 left
🏢 Top 5 Professions by Average Tenure
Teaching, PR, Sales, Other, Marketing
🏭 Top 5 Industries by Turnover
Retail, State, Transport, Telecom, Real Estate
💼 Wage Classification
Greywage (low wage): 11.25%
Whitewage (standard wage): 88.75%
⚙️ Dashboard Features
🔎 Filters for Age Group and Mode of Transport
📊 KPI Cards for quick snapshot of metrics
📈 Line and bar charts for profession and industry analysis
🧮 Donut charts for gender and wage breakdown
🧩 Interactive segmentation by turnover and coaching
📁 Dataset
This dashboard is based on a real-world HR dataset created by Edward Babushkin as part of his work on predicting employee turnover.
Dataset includes anonymized employee-level data:
Gender
Age Group
Industry
Profession
Coaching Status
Tenure
Grey/White Wage Classification
Turnover Label
🛠 Technologies Used
Power BI for data modeling and dashboard development
DAX for calculated measures and KPIs
Power Query for data cleaning and transformation
GitHub for project documentation and versioning
PowerPoint for theme design
🖼️ Screenshots
Dashboard Preview
🙌 Credits
Special thanks to Edward Babushkin for providing the original dataset and insightful blog on employee turnover analytics.
Like this project
Posted May 28, 2025
Created a Power BI dashboard analyzing employee turnover patterns for HR strategy.
Likes
1
Views
7
Timeline
Apr 1, 2025 - Apr 30, 2025