Customer Churn Analysis for Databel
Elizabeth Waweru
Customer Churn Analysis
Overview
Tasked to investigate a dataset provided by a fictitious company called Databel.
An interactive dashboard for a better overview can be found here
The Problem
Analyze why customers are churning at Databel.
Identify the reasons behind their churn.
Explore strategies to reduce churn.
Build With
Power BI
DAX Measures
Background design created in PowerPoint
Key Features
Overview Age Group, Contract Types and Payment Method Insights
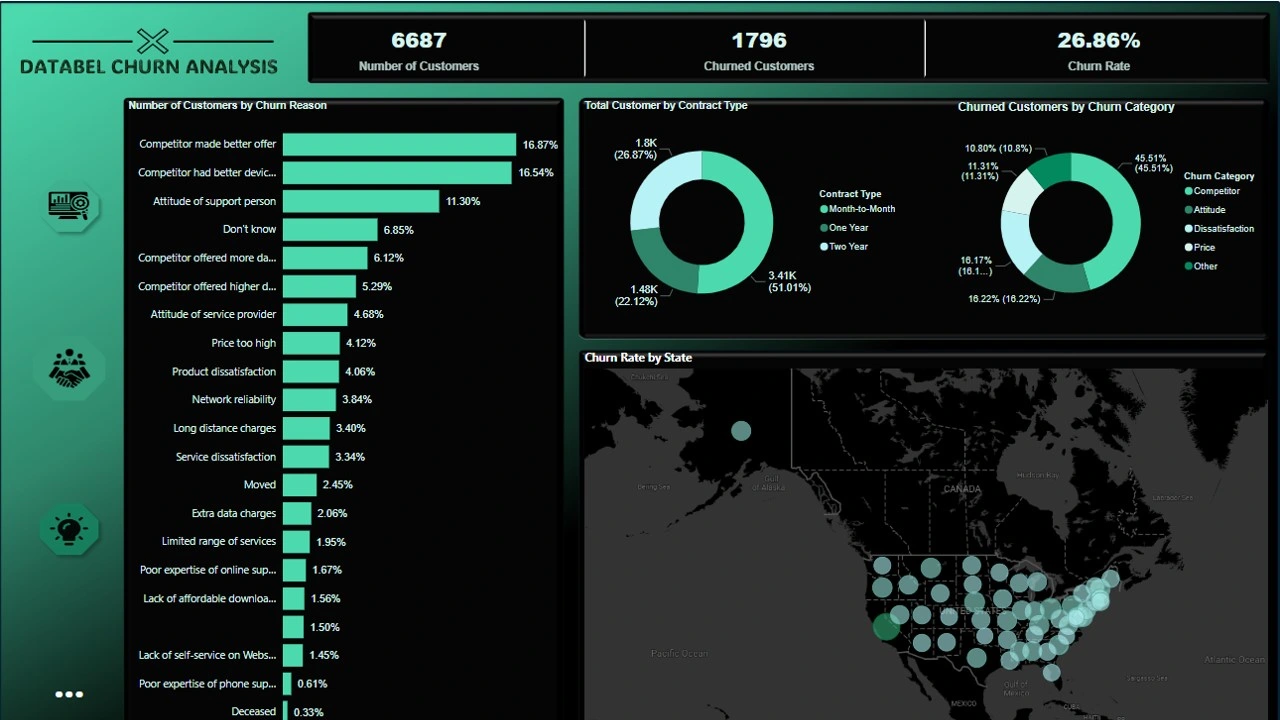
This provides a clear report that explains how churn categories, types of contracts, reasons, and states can affect churn. It provides insights into age groups, contract types, payment methods, and relevant charges based on data consumption. The project offers deeper insights into customer behavior. Includes features for each state related to customer calls and the churn label. Key Insights Key Insights Key Insights - The churn rate for Databel is 26.86%.
- Out of 6,687 customers, 1,796 churned.
- One of the main reasons customers churned is related to competition.
- California had the highest churn rate among the given states (over 60%).
- Customers with month-to-month contracts churned more frequently due to competitors offering better deals and devices, with California experiencing the highest churn rate (over 70%). - The number of calls made to customer service is 6,123, with an average call duration of 0.92 minutes.
- Senior citizens churn more often.
- As age increases, the average churn rate also increases.
- Customers with unlimited data plans are likelier to churn.
- The monthly and churn rates are significantly lower for customers in groups of two or more.
- Customers with unlimited plans incur extra charges for additional data usage.
- Customers who pay by paper check have the highest churn rate. They typically have monthly contracts and stay shorter than other payment methods, with an average of 1.36 customer service calls made. - California has the highest churn rate, along with the lowest number of calls made to customer service. This indicates high competition in the state.
- Ohio had the second-highest number of calls, with significant dissatisfaction reported regarding service quality, including bad attitudes and product issues, particularly related to price and upload speed. It is also important to note that Ohio has the second-highest churn rate.
- On average, customers in Georgia made 3.08 calls to customer service, suggesting that issues were not fully resolved during these calls. The main reason for churn in this state was attributed to poor service attitudes.
Recommendation and Conclusion
Customers who call are often those at risk of churning. Therefore, the nature of the call—whether it’s a complaint or a request for assistance—can be a strong indicator of churn risk. Databel should assign tasks to customer success team members to address these concerns proactively.
It has been observed that some churned customers paid for an international plan but did not utilize it. Databel should consider contacting these customers to inform them about downgrading their plan, which could enhance their satisfaction and reduce churn.
Additionally, it was discovered that 72% of customers do not have a plan. Databel can target these customers with a promotional offer for the international plan, potentially increasing customer engagement and retention.
Although the lack of self-service options was the least noted issue, it is important for Databel to develop a knowledge-based system that addresses frequently asked questions in an FAQ format. This would help reduce long wait times for calls to be answered and for solutions to be provided.
Like this project
Posted May 28, 2025
Analyzed customer churn for Databel using Power BI, identifying key reasons and providing strategic recommendations.
Likes
1
Views
4