Adidas Sales Performance Analysis
Elizabeth Waweru
🏷️ Adidas Sales Analysis
This repository contains a comprehensive sales analysis project based on the Adidas Sales Dataset originally published on Kaggle. The dataset I used was downloaded three years ago, while the version on Kaggle has since been updated (two years ago). As a result, figures shown in this project may differ from the currently available dataset.
📌 Project Overview
This project focuses on analyzing Adidas sales performance across regions, retailers, and product categories. The main goals of this analysis were to:
Clean and structure raw data using Power Query and Excel
Create custom supporting tables, such as a Calendar Table
Perform deeper analysis using DAX in Power BI
Build insightful and interactive visualizations to highlight trends and key metrics
🔧 Tools & Technologies
🧹 Power Query – Data cleaning, transformation, and integration
📊 Microsoft Excel – Used for early-stage data comparison and cleaning
📅 Calendar Table – Custom-built to enable time intelligence in DAX
📈 Power BI – DAX measures and interactive visual dashboards
📉 Key Metrics Visualized
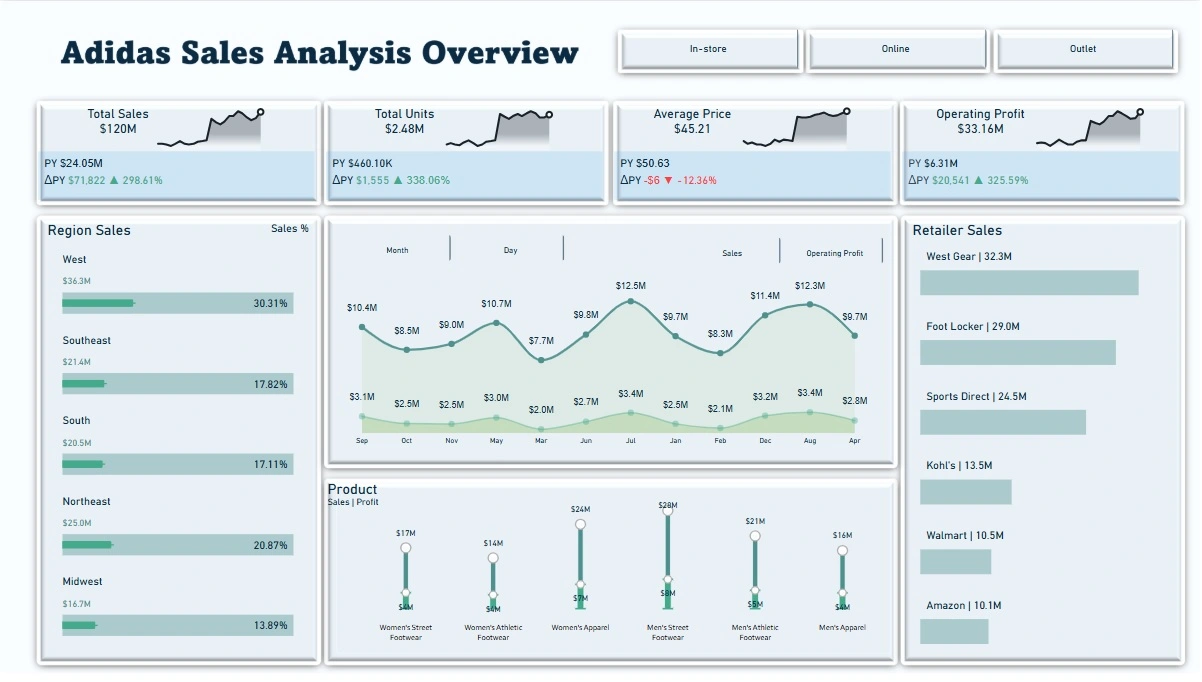
Total Sales: $120M
⬆️ +298.61% vs PY ($24.05M)
Total Units Sold: 2.48M
⬆️ +338.06% vs PY (460.1K)
Average Price: $45.21
⬇️ -12.36% vs PY ($50.63)
Operating Profit: $33.16M
⬆️ +325.59% vs PY ($6.31M)
🗺️ Regional Sales Breakdown
Region Sales (M) % of Total West $36.3 30.31% Northeast $25.0 20.87% Southeast $21.4 17.82% South $20.5 17.11% Midwest $16.7 13.89%
🏬 Top Retailers by Sales
West Gear – $32.3M
Foot Locker – $29.0M
Sports Direct – $24.5M
Kohl's – $13.5M
Walmart – $10.5M
Amazon – $10.1M
👟 Product Category Insights
Product Category Sales (M) Profit (M) Men's Street Footwear $28M $9M Women's Apparel $24M $7M Men's Athletic Footwear $21M $8M Women's Street Footwear $17M $4M Women's Athletic Footwear $14M $4M Men's Apparel $16M $4M
Dashboard
📅 Time-Series Trends
The analysis includes sales and profit performance tracked monthly and daily, enabling trend recognition and performance seasonality across the year.
📌 Key Insights
The West region is the top-performing region by a large margin.
Men’s Street Footwear is the most profitable and highest-selling product.
The business saw significant YoY growth in sales (+298%) and profit (+325%).
Despite strong performance, the average unit price dropped by 12.36%, likely due to volume discounting or product mix shifts.
Retailers like West Gear and Foot Locker are major contributors to revenue.
📁 Folder Structure
✅ Status
This project is complete based on the 3-year-old dataset. Updates may be considered in the future using the latest Kaggle version.
Like this project
Posted May 28, 2025
Comprehensive sales analysis of Adidas using Power BI and Excel.
Likes
1
Views
5
Timeline
May 14, 2025 - May 20, 2025
Clients
Adidas