The network for creativity
Join 1.25M professional creatives like you
Connect with clients, get discovered, and run your business 100% commission-free
Creatives on Contra have earned over $150M and we are just getting started
Back to feedPost

📊 GLOBAL AI STOCK MARKET PERFORMANCE DASHBOARD
Artificial Intelligence is no longer influencing individual companies alone — it is reshaping entire financial markets.
At Intersect Analytics, we developed this interactive Global AI Stock Market Performance Dashboard to analyze how AI investment is driving market performance across the United States, South Korea, Taiwan, Europe, China, and Japan.
Our analysis highlights several key findings:
✅ South Korea's KOSPI significantly outperformed many major global markets, driven largely by AI-related semiconductor companies.
✅ Massive AI capital expenditure by major US technology companies continues to fuel global semiconductor demand.
✅ Market concentration risk is increasing, with a small number of companies accounting for a significant share of market performance.
✅ Retail investor participation has reached historic levels in some markets, increasing both opportunity and risk.
✅ AI infrastructure spending is becoming one of the strongest drivers of global equity markets.
How We Built This Solution
This dashboard was developed using a complete Business Intelligence workflow:
• Data collection and market research
• Data transformation and modeling
• Power Query data preparation
• DAX calculations and performance measures
• KPI development and financial analysis
• Geographic and market visualization
• Risk assessment and investment analysis
• Executive dashboard design in Power BI
Services Delivered by Intersect Analytics
📈 Power BI Dashboard Development
📊 Financial & Market Analytics
🤖 Business Intelligence Solutions
⚙️ Data Modeling & Automation
📉 Executive Reporting & KPI Design
🗄️ Power Query & DAX Optimization
🌍 Economic & Market Intelligence Dashboards
☁️ Data Integration & Analytics Infrastructure
At Intersect Analytics, we help businesses, investors, and organizations transform complex data into clear insights that support better decisions.
DECISIONS BACKED BY DATA.
GROWTH DRIVEN BY INSIGHT.
#PowerBI #BusinessIntelligence #DataAnalytics #FinancialAnalytics #ArtificialIntelligence #StockMarket #DashboardDesign #DataVisualization #InvestmentAnalytics #BusinessGrowth


The network for creativity
Join 1.25M professional creatives like you
Connect with clients, get discovered, and run your business 100% commission-free
Creatives on Contra have earned over $150M and we are just getting started
Related posts

This interactive dashboard provides a comprehensive view of profit performance across multiple dimensions—time, segments, regions, categories, and sub‑categories.
This dashboard transforms raw business data into actionable insights by allowing stakeholders to quickly identify profitable areas, spot regional trends, and evaluate category performance. It’s designed for clarity, interactivity, and decision‑making support.
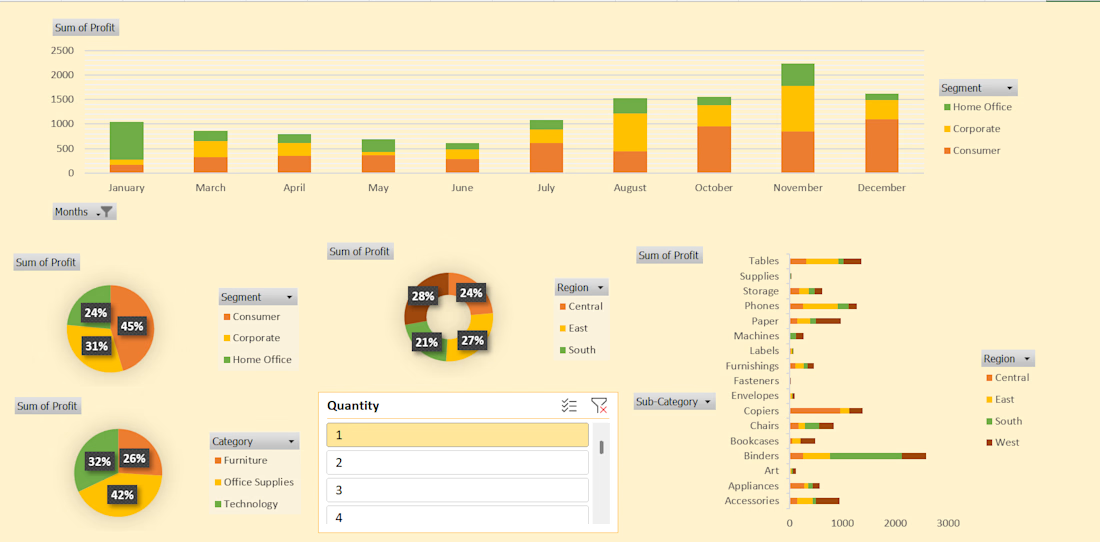
#This is an excellent Profit Dashboard which is made in MS Excel with multiple creative functions help in understanding Monthly , Yearly , Area wise Profits.

Business data often lives across payment, analytics, CRM, advertising, and inventory platforms. Metrik brings those signals together in one dashboard built for startups and small businesses.
See revenue, orders, customers, and business health at a glance. Compare advertising spend and ROAS across channels, explore visual KPI cards, and use smart alerts to spot unusual changes and potential risks.
The interface pairs a clean layout and rounded components with soft gradients, colorful analytics, and clear visual hierarchy, helping make business performance easier to follow.


Having trouble deciding on the final material palette? Take a look at our latest case study showing how we helped test different kitchen finishes in 3D - from swapping range hoods to testing bold versus neutral backsplashes. Check out the full project on my profile to see how visualization speeds up design approvals!