The network for creativity
Join 1.25M professional creatives like you
Connect with clients, get discovered, and run your business 100% commission-free
Creatives on Contra have earned over $150M and we are just getting started
Back to feedPost
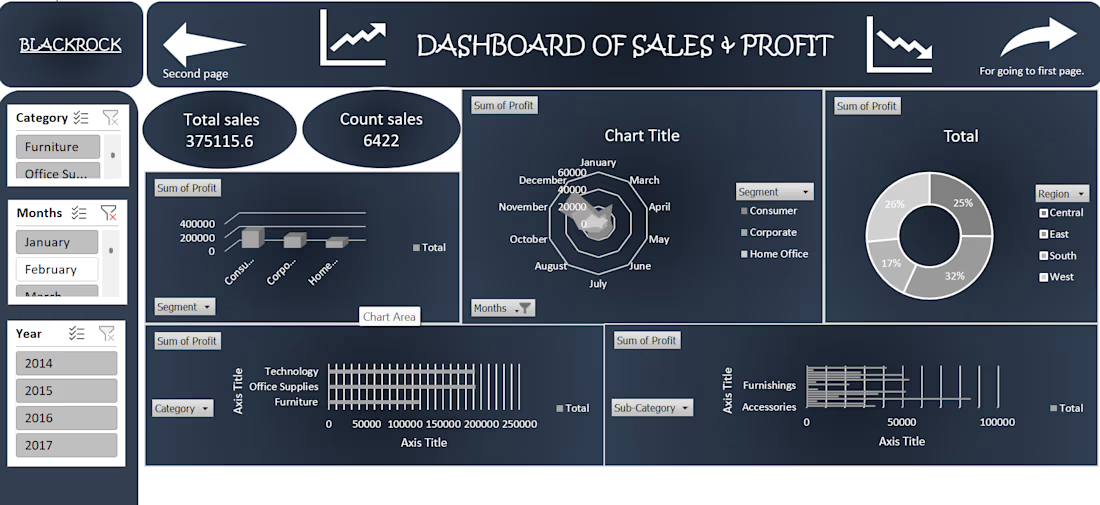
This interactive dashboard provides a comprehensive view of profit performance across multiple dimensions—time, segments, regions, categories, and sub‑categories.
This dashboard transforms raw business data into actionable insights by allowing stakeholders to quickly identify profitable areas, spot regional trends, and evaluate category performance. It’s designed for clarity, interactivity, and decision‑making support.


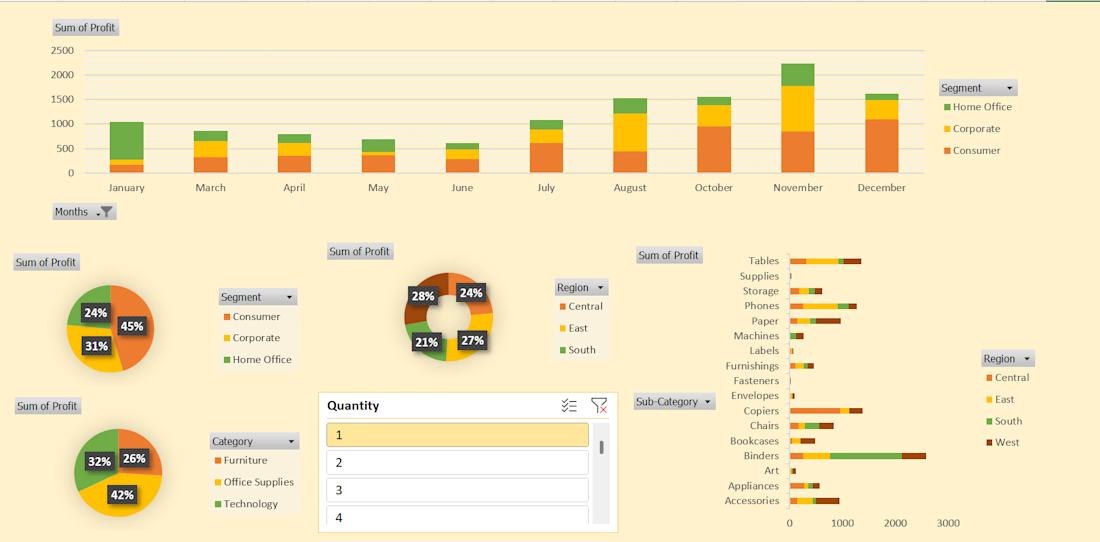

#This is an excellent Profit Dashboard which is made in MS Excel with multiple creative functions help in understanding Monthly , Yearly , Area wise Profits.
The network for creativity
Join 1.25M professional creatives like you
Connect with clients, get discovered, and run your business 100% commission-free
Creatives on Contra have earned over $150M and we are just getting started



Related posts

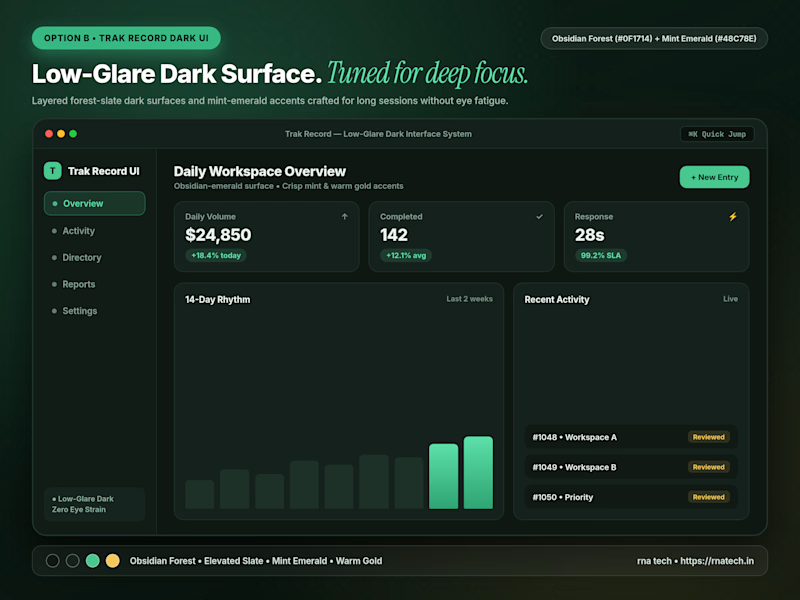
Quick poll for builders & designers here: When you're designing a data-heavy dashboard that people keep open for 6+ hours a day, do you default to Warm Light Mode or Low-Glare Dark Mode first?
4 voted
67%
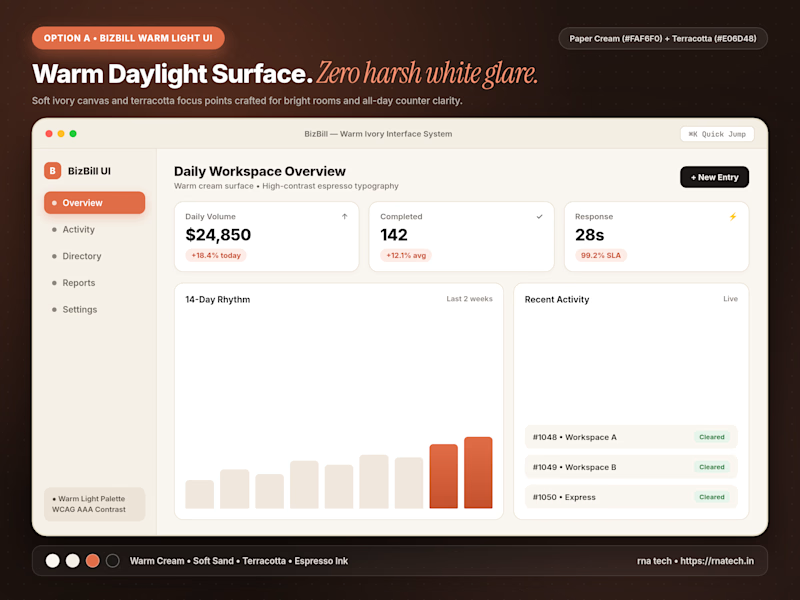
2 voted
33%
6 votes
Closed

I’d start with warm light mode for a clean, comfortable look, but low-glare dark mode is a great option for long working hours too!
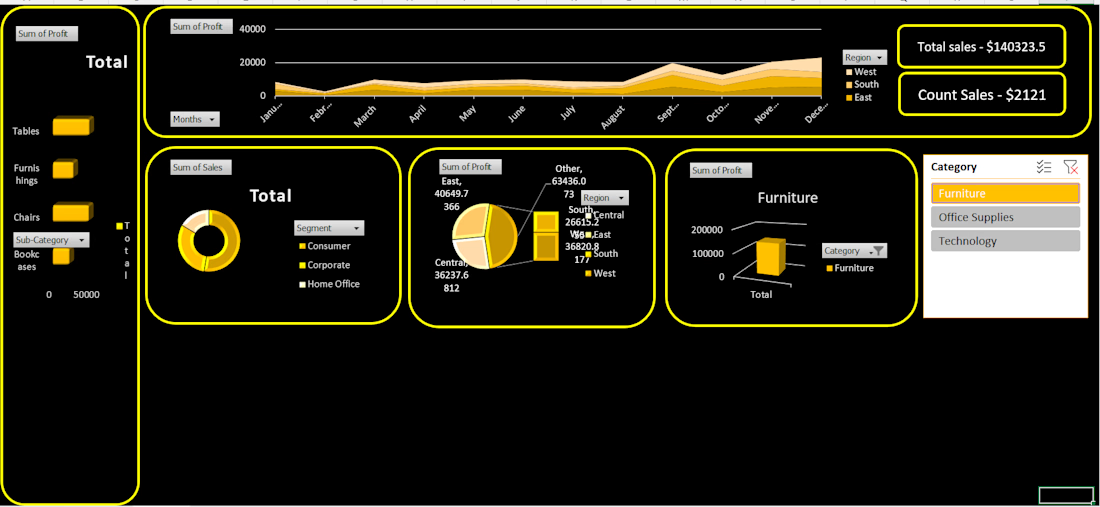
I: just created a Sales and Profit dashboard! Designed to provide a clear overview of business performance, tracking total sales, order count, and profit distribution across region and product categories. Includes interactive filters by year, category, and month for detailed data analyst.
This is a sales and profit dashboard . fully dynamic easy to understand