Freelancers using PostgreSQL in KalyanFreelancers using PostgreSQL in Kalyan
Wordsmith for hire: Writing, research, consulting
5.0
Rating
3
Followers
Wordsmith for hire: Writing, research, consulting
I build AI-powered data apps and dashboards
12
Followers
I build AI-powered data apps and dashboards
Cover image for Project Overview This is a personal portfolio and services s...
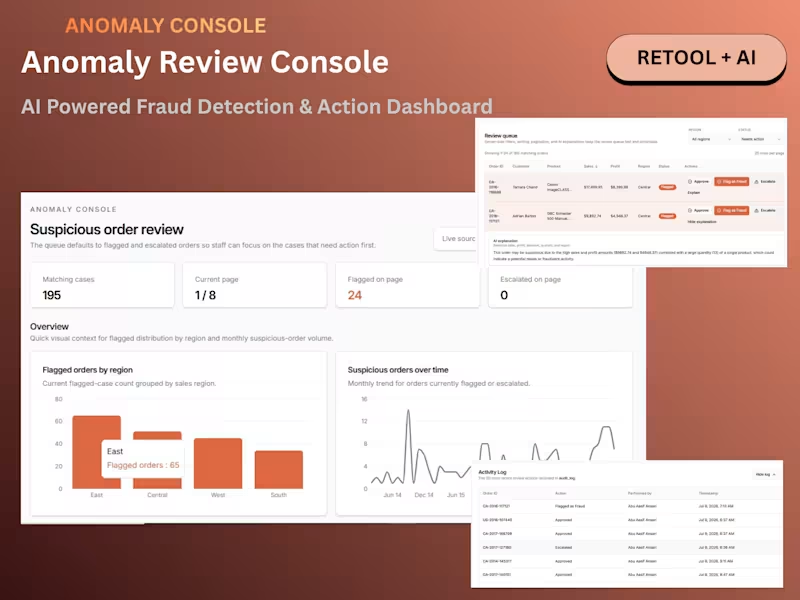
Project Overview This is a personal portfolio and services site built for a working freelancer β€” myself β€” as part of the Make It Real Challenge. I'm a data visualization specialist and AI dashboard developer, and I wanted the site itself to reflect that work rather than just describe it. So instead of stock photography and generic copy, every visual on the site is a real screenshot from a project I've actually shipped. The Concept Most freelance portfolio sites lean on polished lifestyle photography β€” laptops on wooden desks, people in blazers looking thoughtfully at monitors. I wanted to flip that: let the actual product screens do the talking. The site is built around a simple idea β€” "solutions built on data, not guesswork" β€” and that shows up literally in the visuals, not just the copy. What's on the site Homepage: A direct hero statement ("I Turn Messy Data Into Decisions") backed immediately by a real dashboard screenshot from my Anomaly Review & Action Console, followed by a "recent work" section pulling in three separate real projects. Services page: Four core offerings β€” Anomaly Detection Dashboards, Power BI & Data Analytics, AI-Integrated Internal Tools, and Custom Data Automation β€” each paired with an actual screenshot of that specific project (not a mockup). About page: A short, direct bio and a real photo, no filler. Contact page: A simple inquiry form paired with a data-visualization graphic that matches the site's overall theme. How I used Finish Layer Block Animations: I used on-appear and on-scroll triggers (Reveal and Slide styles) across the homepage, services, and contact pages. Section headings reveal as the page loads, and content blocks slide/fade in as the visitor scrolls β€” this turns what would be a static, all-at-once page into a guided, paced experience. Block Transform: Rather than a flat grid, I applied a subtle rotation to a couple of key visuals (a dashboard screenshot and the contact-page graphic) β€” just a few degrees, enough to break the rigidity of the layout without sacrificing readability. It gives the page an asymmetrical, more intentional feel instead of looking templated. Process I built this using Squarespace's Blueprint AI to get a fast base structure, then went through every page replacing AI-generated placeholder content (stock imagery, generic service descriptions, an accidental product/ecommerce section) with real project data, real screenshots, and copy that actually reflects how I work with clients. The site is password-protected rather than published on a paid plan, and is fully responsive across desktop and mobile. Access: πŸ”— Site: https://pike-megalodon-4yb2.squarespace.com (https://pike-megalodon-4yb2.squarespace.com)πŸ”‘ Password: Omega
2
259
Full-stack dev. 6 years. I've shipped, not just coded.
New to Contra
Full-stack dev. 6 years. I've shipped, not just coded.
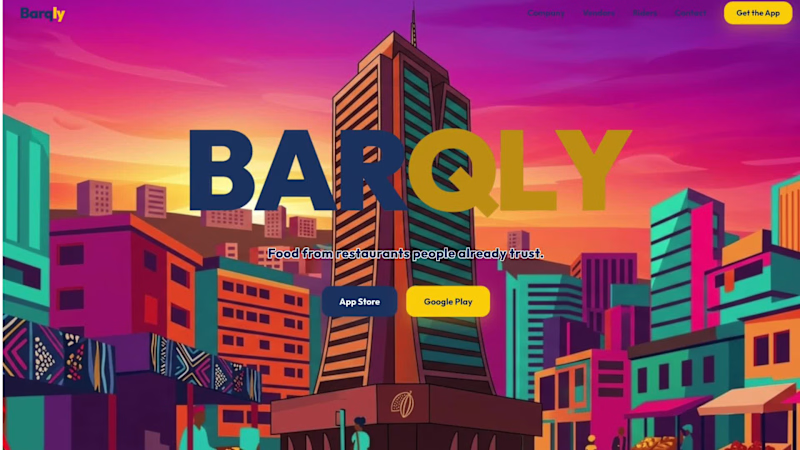
Cover image for Barqly: Multi-App Food Delivery Platform

Built
Barqly: Multi-App Food Delivery Platform Built a production-ready food delivery platform with separate apps for customers, vendors, and riders, plus an admin dashboard, customer web app, marketing website, and backend system. The platform handles ordering, payments, wallet/coins, live rider tracking, vendor order management, dispatch, refunds, analytics, and admin operations. What I Built: I developed the full Barqly ecosystem end to end: - Customer mobile app for browsing restaurants, checkout, payments, wallet, order tracking, and support. - Vendor mobile app for receiving orders, managing preparation, and store operations. - Rider mobile app for deliveries, live location, job handling, earnings, and proof uploads. - Admin web dashboard for orders, users, vendors, riders, payments, fraud/CRM, dispatch, batching, and live control tower. - Customer web app for ordering from browser. - Public website/landing page for the brand. - Backend API with authentication, payments, wallet, Barqly Coins, dispatch, notifications, refunds, payouts, analytics, and deployment setup. Links: Website: https://www.barqlyapp.com/ (https://www.barqlyapp.com/)Customer App : Play Store (https://Play Store / App Store) / App Store (https://apps.apple.com/in/app/barqly-food/id6761429746)Vendor App: Play Store (https://play.google.com/store/apps/details?id=com.barqly.partner) / App Store (https://apps.apple.com/in/app/barqly-partner/id6761430094)Rider App: Play Store (https://play.google.com/store/apps/details?id=com.barqly.rider&hl=en_IN) / App Store (https://apps.apple.com/in/app/barqly-rider/id6761430018)
1
77
Product Manager
New to Contra
Product Manager
Full-stack developer building SaaS apps with modern web tech
Freelance Web Developer & AI Enthusiast helping brands build

Data Specialist for Clean, Organized & Smart Reports
New to Contra
Data Specialist for Clean, Organized & Smart Reports
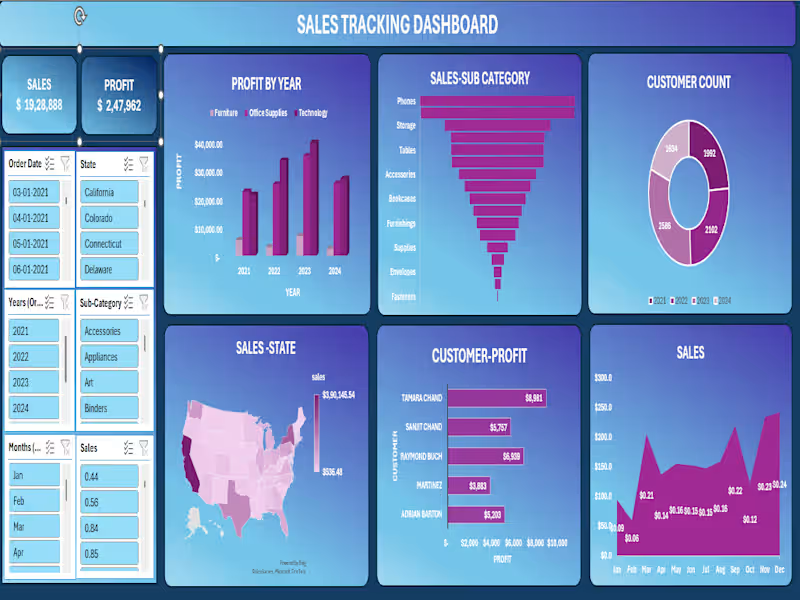
Cover image for πŸ“Š Sales Tracking Dashboard |
πŸ“Š Sales Tracking Dashboard | Excel + Power BI Project Built an end-to-end interactive Sales Tracking Dashboard covering 2021–2024 across the entire US market. Top-Line Numbers: πŸ’° Total Sales: $19,28,888 πŸ“ˆ Total Profit: $2,47,962 πŸ‘₯ Total Customers: 8,314 across all years What the dashboard reveals: πŸ† Best-selling sub-categories: Phones ($2,79,464) and Chairs ($2,77,058) lead the pack β€” together accounting for nearly 29% of all sales πŸ“… Profit growth year-on-year: β†’ 2021: $49,556 β†’ 2022: $61,618 β†’ 2023: $81,786 β€” consistent upward trajectory across Furniture, Office Supplies & Technology πŸ—ΊοΈ Geographic concentration: California dominates at $3,90,145 in sales. New York ($2,46,517) and Texas ($1,51,436) follow. West Virginia sits at the bottom with just $536 β€” a clear signal for regional strategy review. πŸ“¦ Technology drives profit β€” highest-margin category across all 4 years, despite Furniture holding significant volume 🧾 Seasonal trends: Q4 is king β€” November ($2,34,013) and December ($2,41,464) are the strongest months. February dips to just $59,640 β€” opportunity for targeted campaigns. πŸ‘€ Top customer by profit: Tamara Chand at $8,981, followed by Raymond Buch ($6,939) and Sanjit Chand ($5,757) Tools used: Microsoft Excel Β· Pivot Tables Β· Power Query Β· Charts & Slicers Β· Dashboard Design This project sharpened my ability to turn raw transactional data into a clean, decision-ready visual β€” with filters for state, date, year, sub-category, and month. Open to feedback! πŸ‘‡ #Excel #DataAnalytics #SalesDashboard #DataVisualization #BusinessIntelligence #MicrosoftExcel #DashboardDesign
0
20
πŸ” Transforming Data into Business Insights