Research-Driven Copy for Thought Leaders & Changemakers
- 5.0
- Rating
- 4
- Followers
Research-Driven Copy for Thought Leaders & Changemakers


Driving Revenue Generation Using Data Science || Go + Python
- 9
- Followers
Driving Revenue Generation Using Data Science || Go + Python
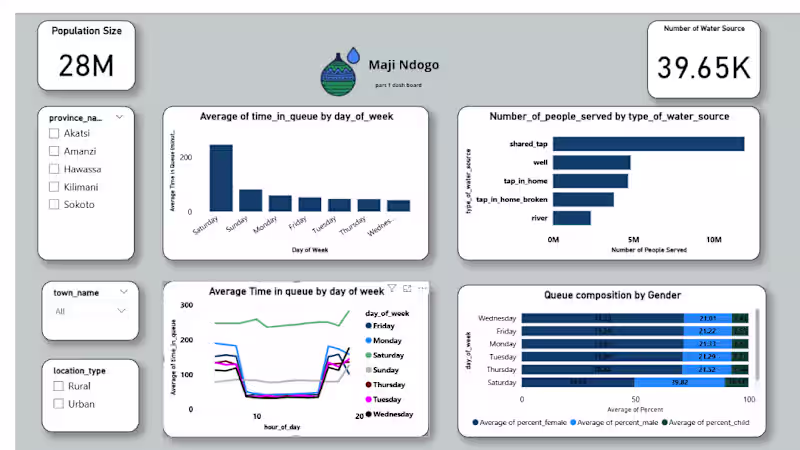
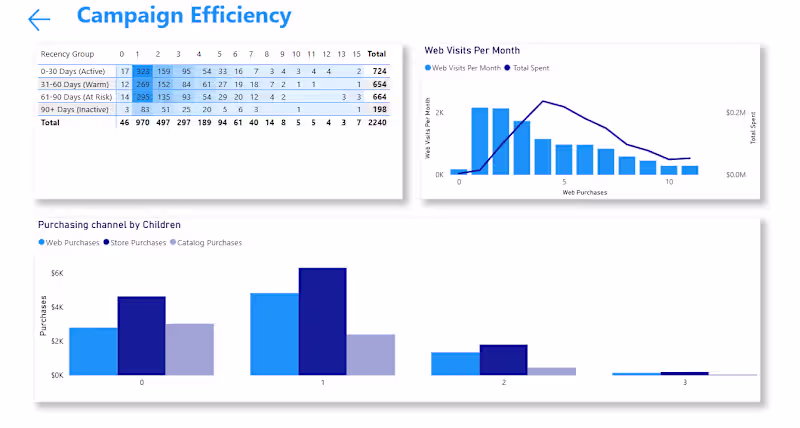
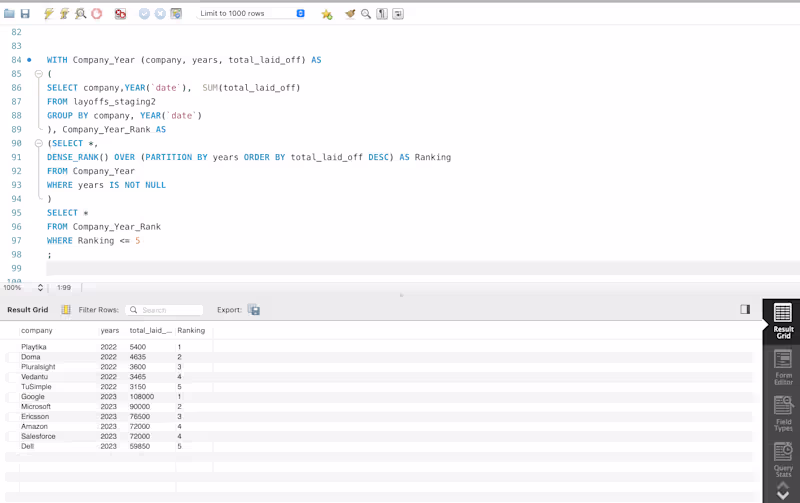
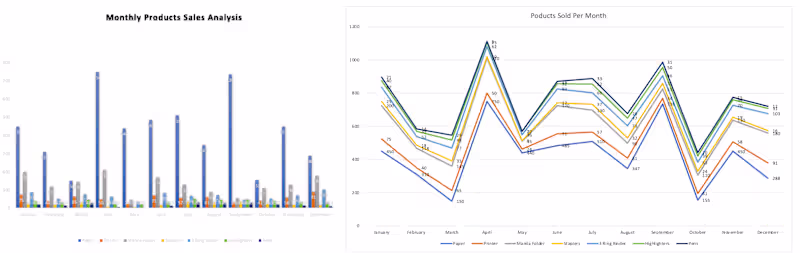
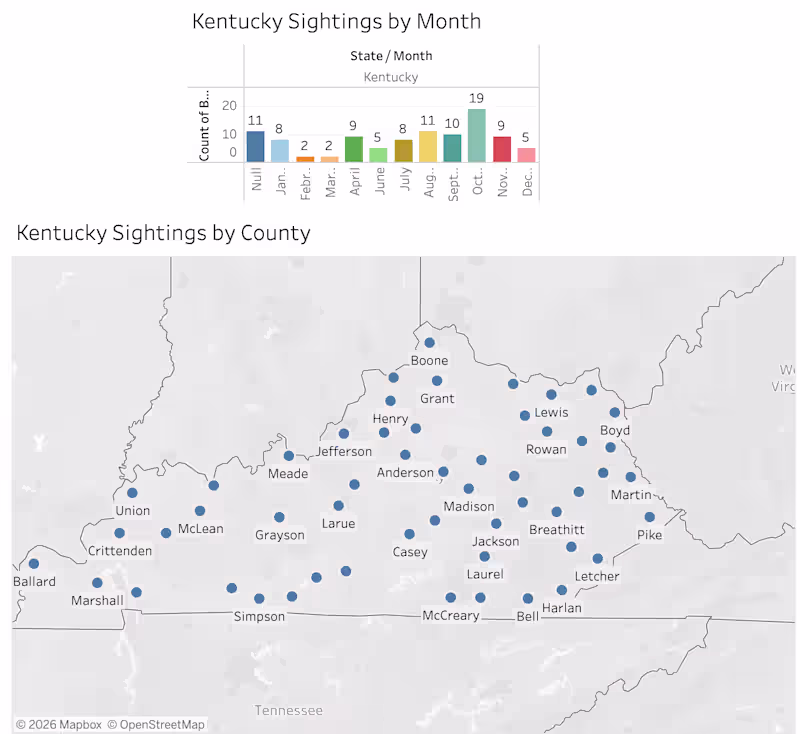
Data Analyst: SQL, Python & Power BI for actionable insights
Data Analyst: SQL, Python & Power BI for actionable insights

Expert in Sales, Business Development, and Growth Strategies
Expert in Sales, Business Development, and Growth Strategies


View more →
Software Engineer | Python | Django | React | AWS
Software Engineer | Python | Django | React | AWS


Data Analyst & Wordpress Developer
Data Analyst & Wordpress Developer
Data Analyst | Excel & SQL | Data Cleaning and Insights.
New to Contra
Data Analyst | Excel & SQL | Data Cleaning and Insights.
Data Scientist building data assets
Data Scientist building data assets


View more →