The network for creativity
Join 1.25M professional creatives like you
Connect with clients, get discovered, and run your business 100% commission-free
Creatives on Contra have earned over $150M and we are just getting started
Back to feedPost

Should you always double down on your #1 market? 🌍
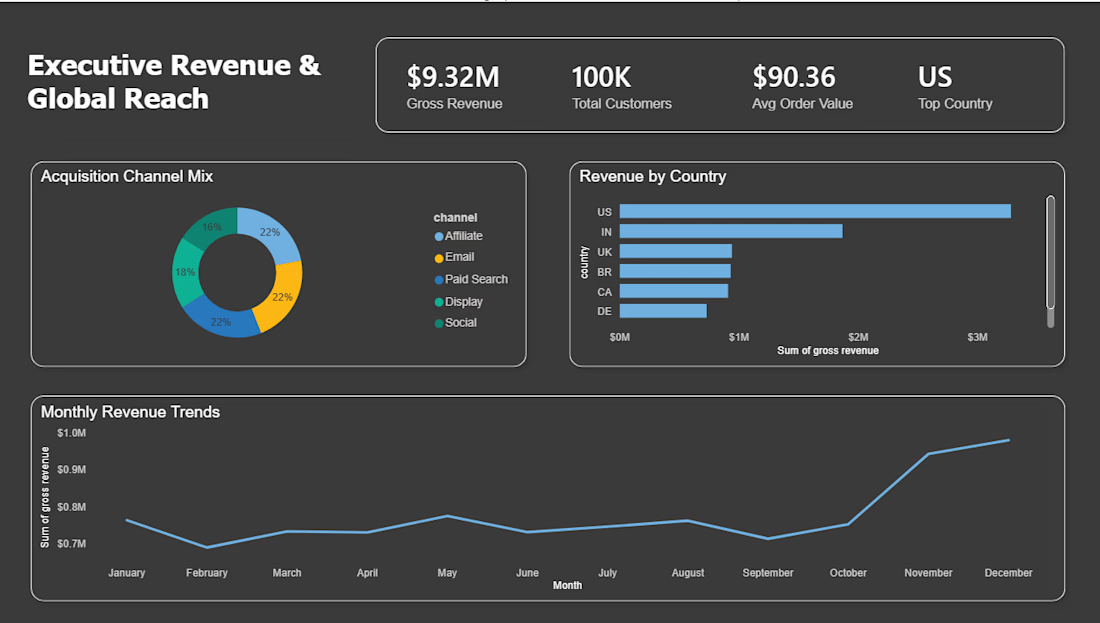
While building this Executive Revenue dashboard, the data told a different story. Instead of pouring more into the US market, we identified a massive opportunity to make countries 2-4 (India, UK, and Brazil) more competitive.
The Tech Stack:
ETL: Pandas (Python)
Database: MySQL
Viz: Power BI
Moving from 5 scattered CSVs to a centralized SQL-backed dashboard allowed us to see a $9.32M revenue stream clearly for the first time.


The network for creativity
Join 1.25M professional creatives like you
Connect with clients, get discovered, and run your business 100% commission-free
Creatives on Contra have earned over $150M and we are just getting started





Related posts

Welcome! Are you looking to turn messy data into clear, actionable insights? You're in the right place.
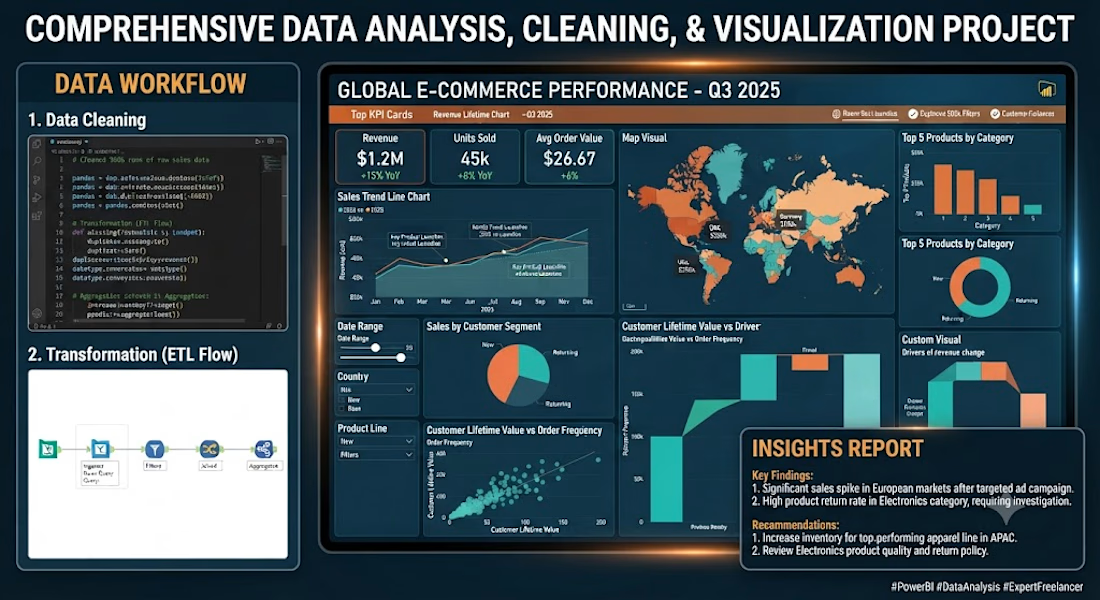
As a professional data analyst, I specialize in transforming raw data into clean, structured, and visually compelling dashboards that help businesses make smarter decisions.
What I Offer:
• Data Cleaning & Preparation (Handling missing values, removing duplicates, formatting)
• Exploratory Data Analysis (EDA) to find key trends and patterns
• Interactive Dashboards & Reports (Power BI/ Excel)
• Custom DAX / SQL queries for deep metric tracking
• Professional summary report with key business insights
Tools I Use:
• Power BI
• Python & SQL
• Advanced Excel & Google Sheets
Why Choose Me?
• High-quality, clean design with user-friendly layouts
• Fast turnaround time and clear communication
• 100% satisfaction guarantee
Let's unlock the story behind your data! Please contact me before placing an order so we can discuss your specific project goals.


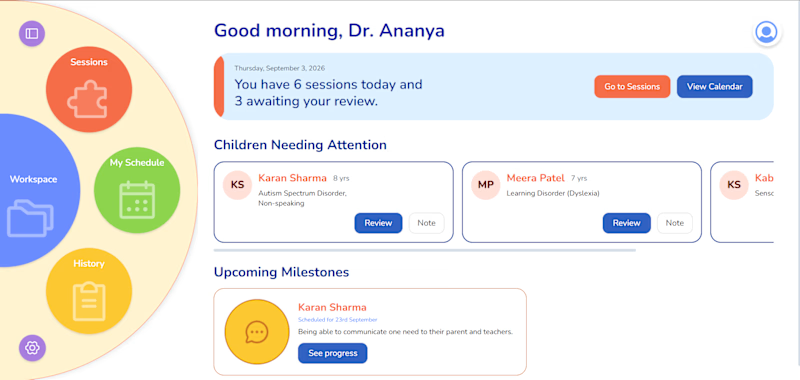
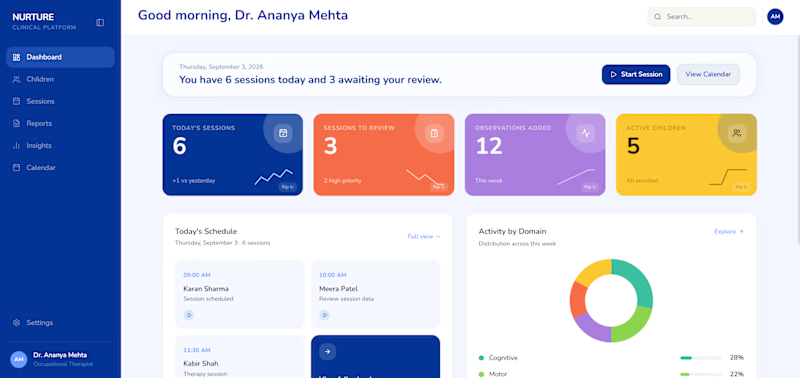
Which dashboard works better for an Occupational therapist?

2 voted
40%
3 voted
60%
5 votes
Closed

Dashboard should be for how much data can be scanned in the shortest time possible.
Bright Colors are distraction here.

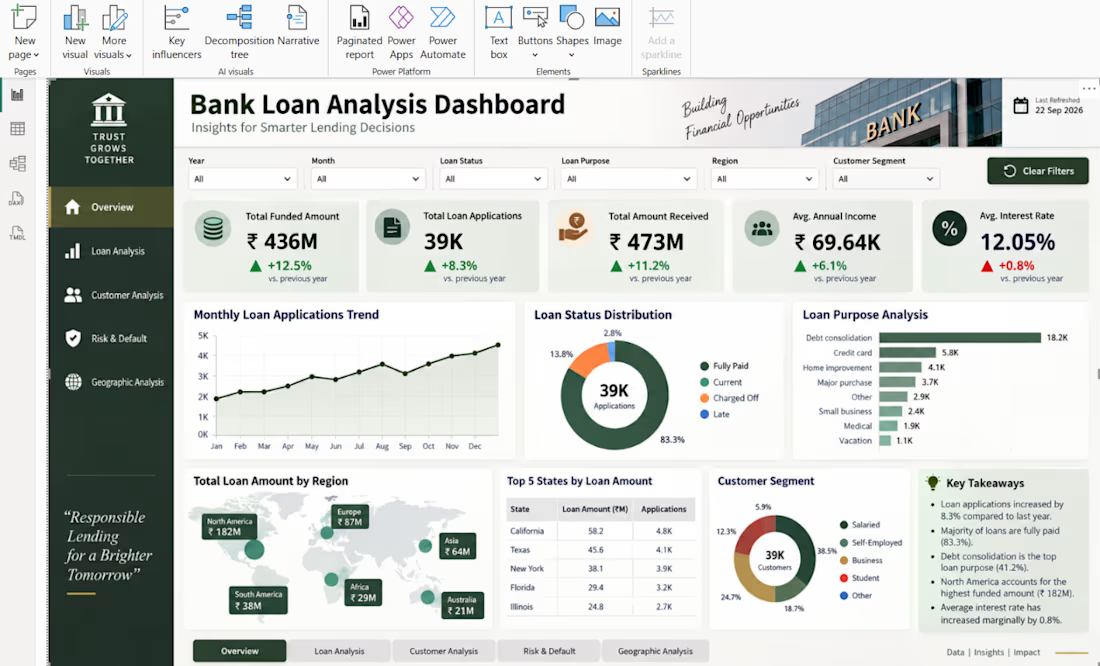
I created an interactive Bank Loan Analysis Dashboard to analyze loan applications, funded amounts, repayments, customer segments, loan purposes, risk, and regional performance.
The dashboard includes KPIs, monthly loan trends, loan status distribution, loan purpose analysis, regional analysis, customer segmentation, and key business insights.
Tools used: Power BI, Excel, DAX, Data Analysis, and Data Visualization.
The goal was to turn raw loan data into a clear dashboard that helps identify lending trends, customer patterns, and important business insights.