
Customer Segmentation for Targeted Marketing
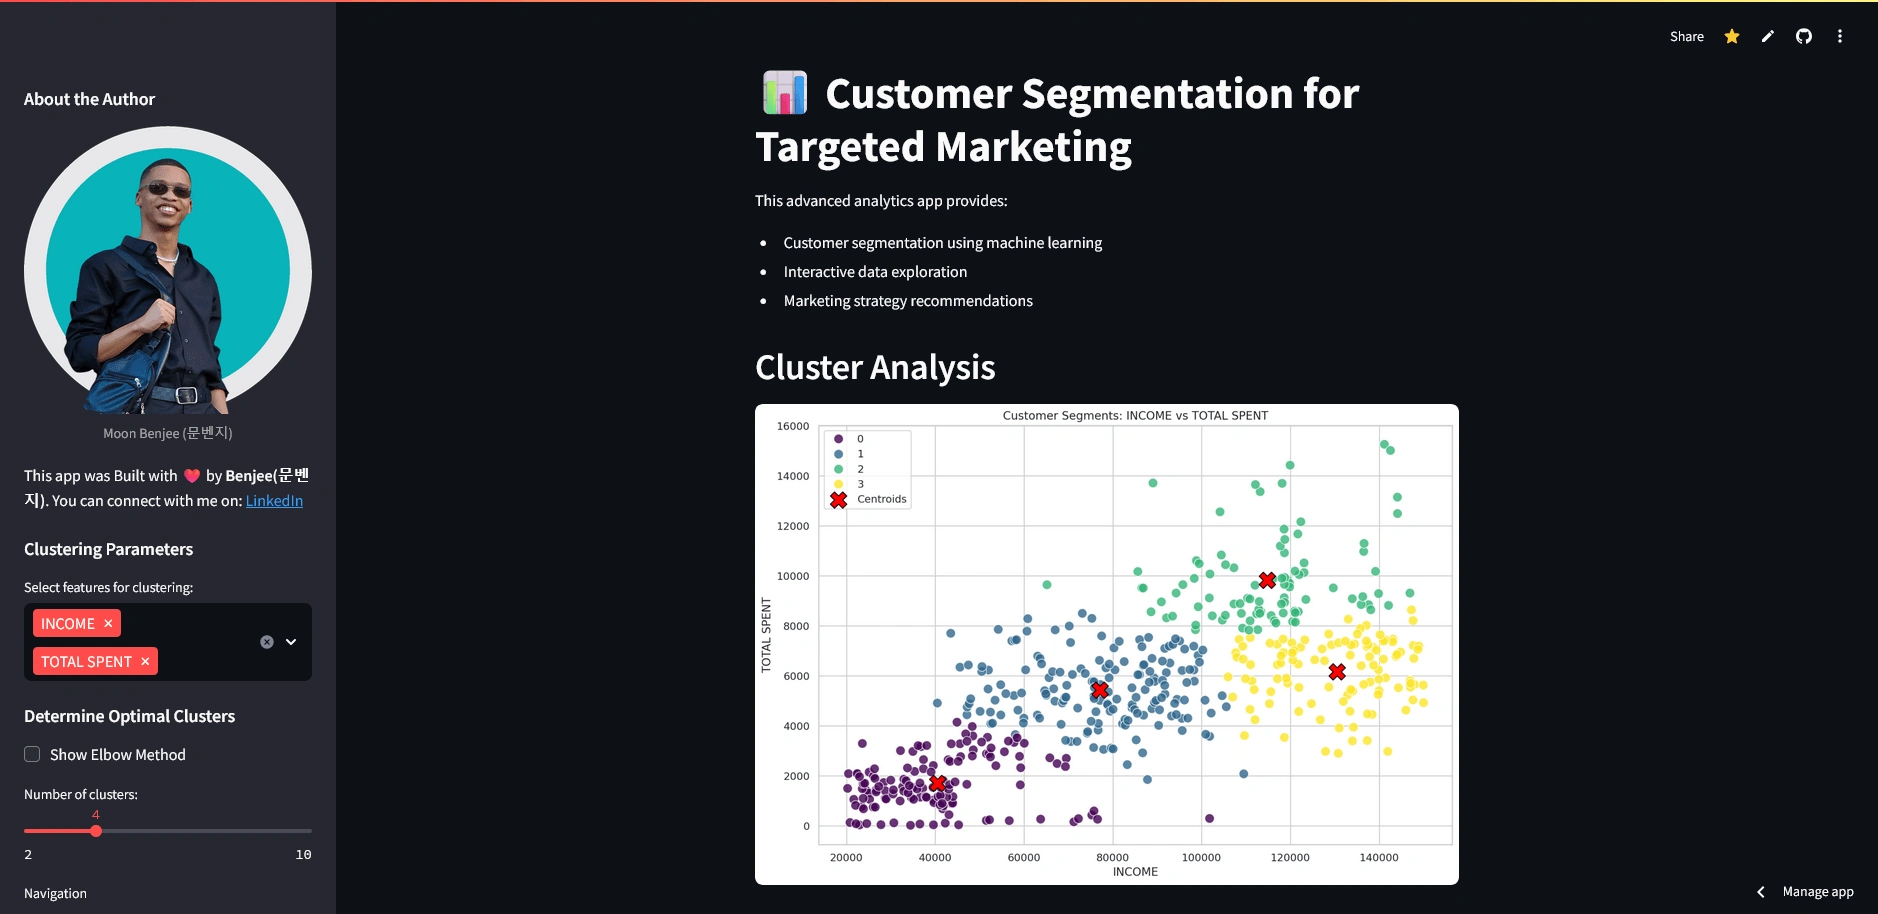
This project uses K-means clustering to identify distinct customer segments based on their income and spending patterns. The insights gained can be used to create more effective, personalized marketing campaigns.
Features
* Data Cleaning and Preprocessing: Cleans raw customer data and prepares it for analysis.
* K-Means Clustering: Implements the K-means algorithm to group customers into segments with similar characteristics.
* Streamlit Web App: Provides an interactive user interface built with Streamlit for:
* Cluster Visualization: Displays the created customer segments with clear visual markers for clusters and their centroids.
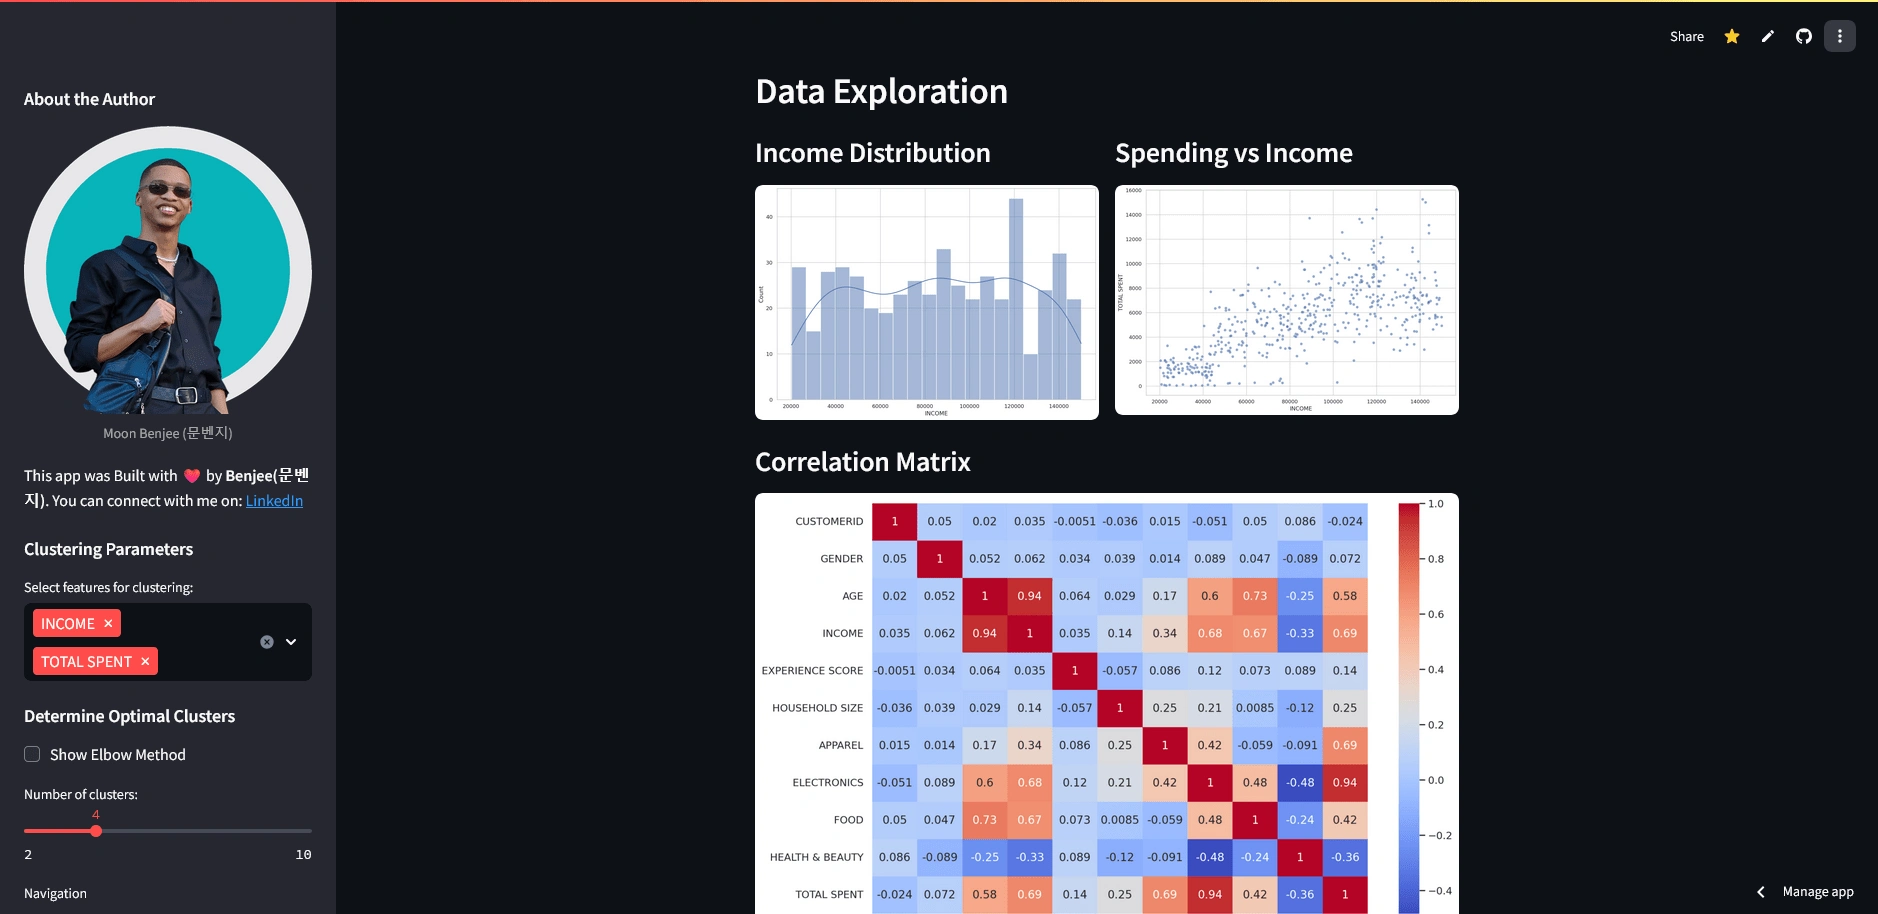
* Exploratory Analysis: Includes basic visualizations (e.g., income distribution) and descriptive statistics.
* Insightful Commentary: Offers a dedicated area for sharing key takeaways and recommendations.
Dataset Structure
* Product Data Set.csv
*
PRODUCT NUM (int): Unique product identifier *
PRODUCT CODE (str): Product code *
UNIT LIST PRICE (float): Original price of the product * ... (other product-related columns)
* Transaction Data Set.csv
*
CUSTOMER NUM (int): Unique customer identifier *
PRODUCT NUM (int): Product identifier (links to Product Data Set.csv) *
QUANTITY PURCHASED (int): Number of units purchased *
DISCOUNT TAKEN (float): Discount applied (0-1) * ... (other transaction-related columns)
* Customer Data Set.csv
*
CUSTOMERID (int): Unique customer identifier *
INCOME (str): Customer's income (with currency symbols) * ... (other customer-related columns)
Code Explanation
* `load_data()`: Reads the CSV files into pandas DataFrames.
* `clean_data()`: Prepares the income column for analysis by removing currency symbols and converting it to numeric format.
* `merge_data()`: Combines data from multiple DataFrames, calculates total spending per customer, and pivots the data to create customer spending profiles.
* `perform_clustering()`: Implements the K-means algorithm with user-specified features and a number of clusters.
* `plot_clusters()`: Visualizes the clusters on a scatter plot.
* `main()`: Coordinates data loading, preprocessing, clustering, and Streamlit app initialization.
Customization and Next Steps
* Add More Features: Consider other relevant features for clustering.
* Experiment with Algorithms: Try different clustering techniques (e.g., DBSCAN).
* Advanced Analysis: Calculate customer lifetime value (CLV) and use it for segmentation.
* Recommendation System: Build a simple recommendation system based on cluster membership.
1 like · 11 views · Mar 18, 2025
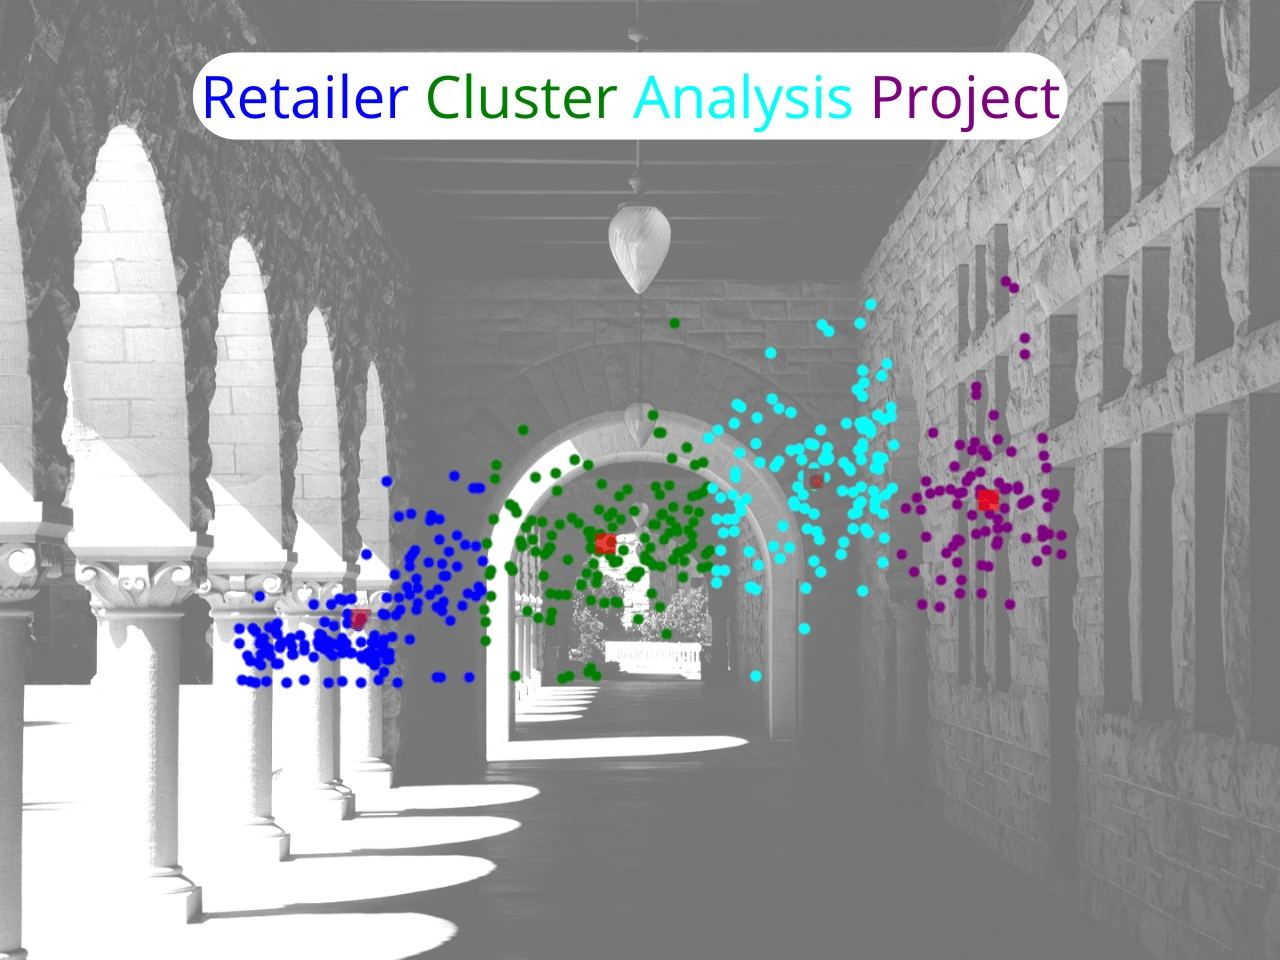
This project uses K-means clustering to identify distinct customer segments based on their income and spending patterns.


