Forex Dashboard Web Application
Benjamin van der Merwe
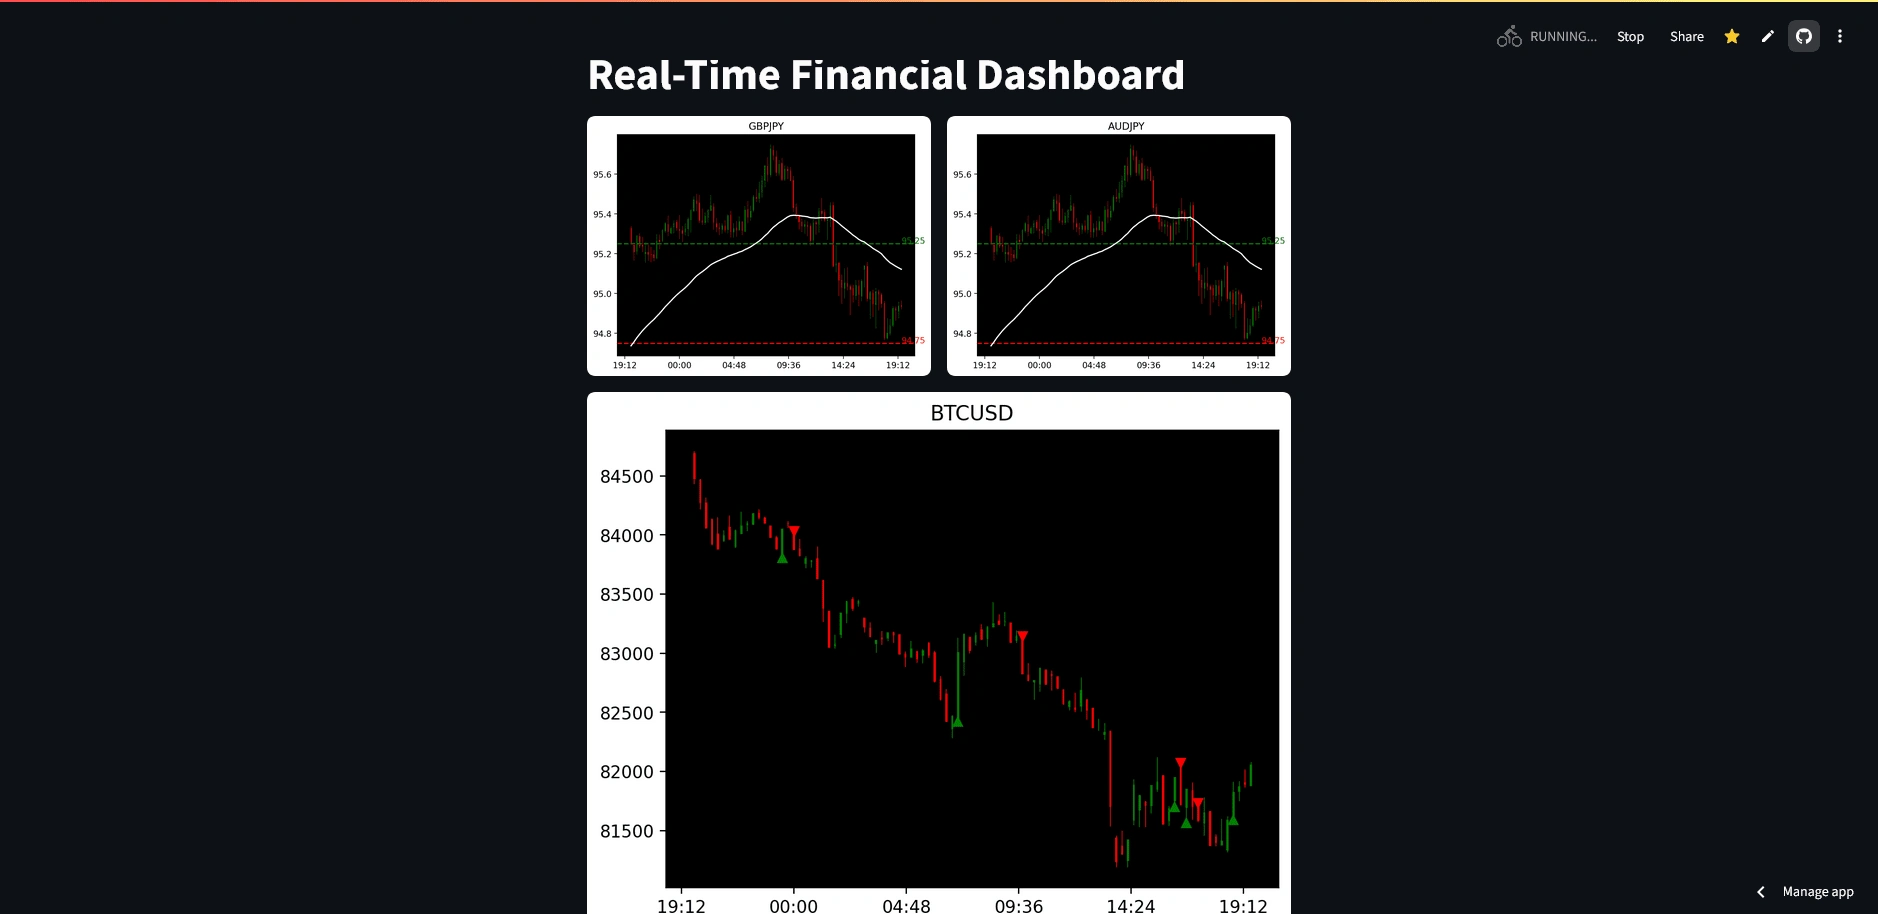
Real-Time Financial Dashboard 📈
This project is a real-time financial dashboard built using Streamlit, yfinance, pandas, and matplotlib. It displays candlestick charts for GBPJPY, AUDJPY, and BTC-USD, along with Quarter Theory levels and a 50-period EMA. For BTC-USD, it also includes Kairi Relative Index (KRI) with Buy/Sell signals.
Features ✨
- Real-time candlestick charts for GBPJPY, AUDJPY, and BTC-USD 📊
- Quarter Theory levels for GBPJPY and AUDJPY 📐
- 50-period EMA for GBPJPY and AUDJPY 📈
- Kairi Relative Index (KRI) with Buy/Sell signals for BTC-USD 🏹
- Data fetched using yfinance 🌐
- Interactive dashboard using Streamlit 🖥️
Libraries Used 📚
- streamlit==1.43.2
- yfinance==0.2.54
- pandas==2.2.3
- matplotlib==3.9.3
- mplfinance==0.12.10b0
Deployment 🚀
The application is deployed at: https://fxdash.streamlit.app
Like this project
Posted Mar 18, 2025
This project is a real-time financial dashboard built using Streamlit, yfinance, and matplotlib. It displays candlestick charts for GBPJPY, AUDJPY, and BTC-USD.