Stock Price Analysis and Prediction Web App
Benjamin van der Merwe
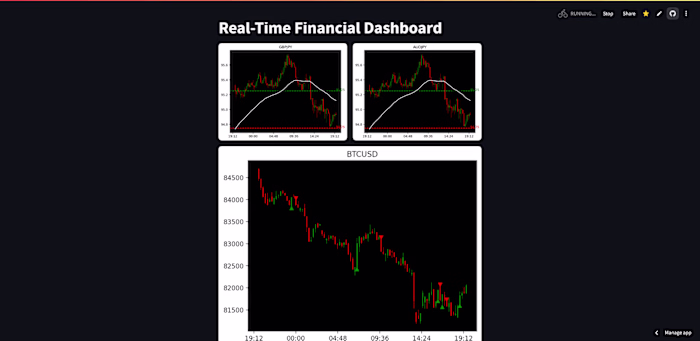
Financial Data Analysis and Machine Learning - https://tickerviz.streamlit.app/
This Streamlit application provides tools for financial data analysis and machine learning-based stock price prediction.
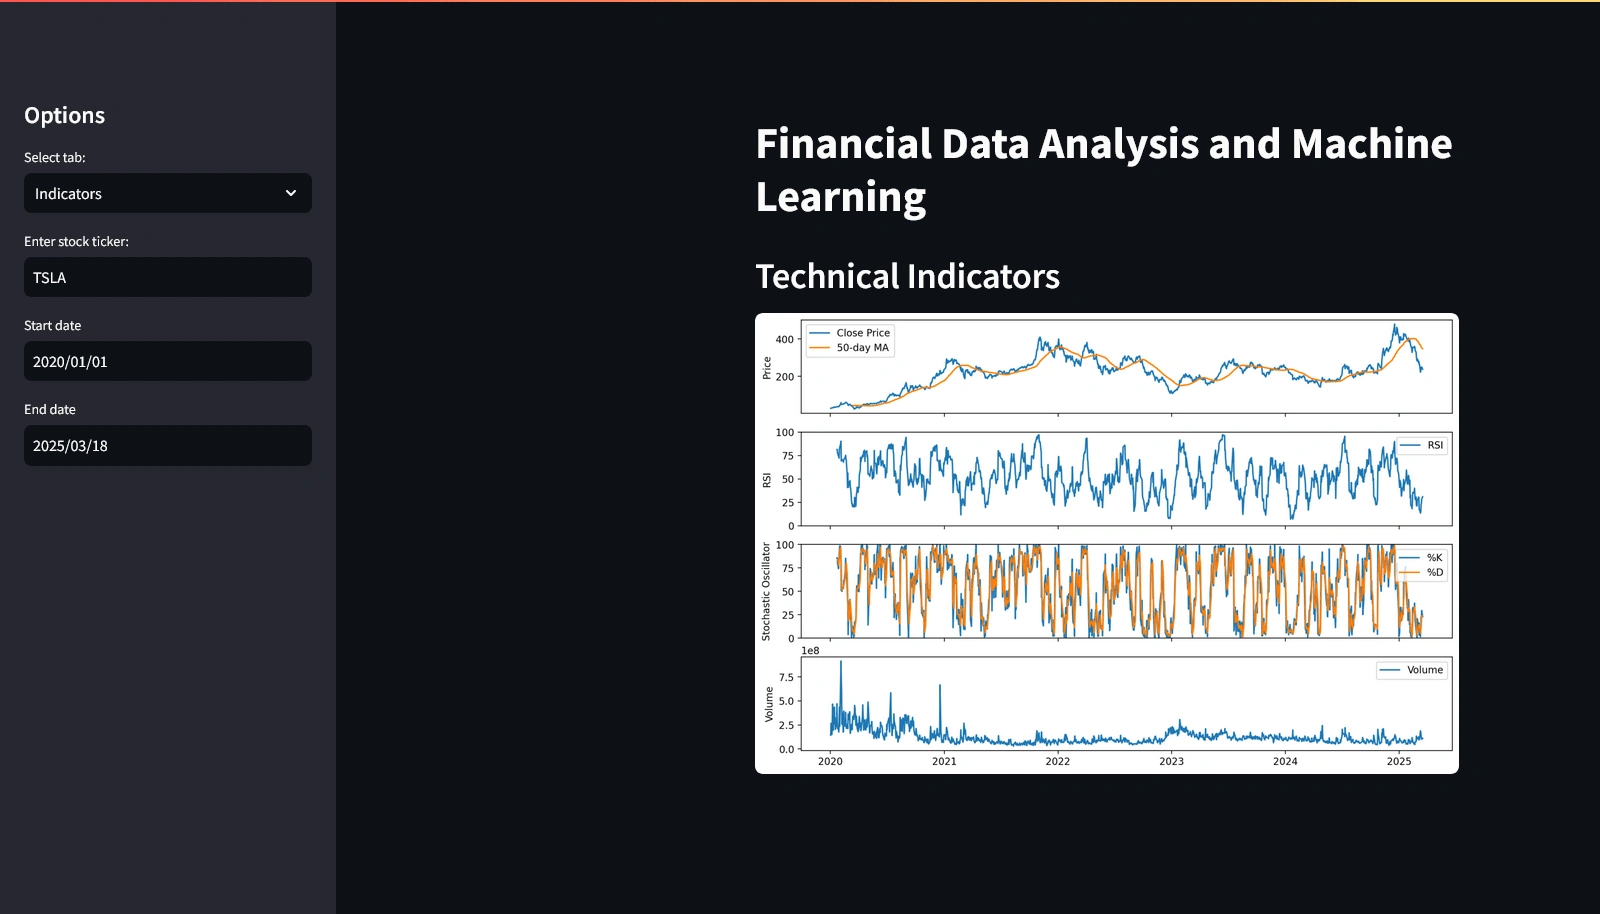
- Technical Indicators:
- Retrieves historical stock data from Yahoo Finance.
- Calculates and visualizes common technical indicators, including:
- 50-day Moving Average (MA50)
- Relative Strength Index (RSI)
- Stochastic Oscillator (%K and %D)
- Volume
- Allows users to select a stock ticker and date range.
- Machine Learning Models:
- Implements machine learning models for stock price prediction:
- Long Short-Term Memory (LSTM) neural network
- Support Vector Machine (SVM)
- Light Gradient Boosting Machine (LightGBM)
- Preprocesses data using MinMaxScaler.
- Splits data into training and testing sets.
- Trains and evaluates the models using Root Mean Squared Error (RMSE).
- Displays the prediction for the next days closing price.
- Visualizes the predicted vs. actual stock prices.
- Allows users to select a stock ticker and date range.
Code Explanation
- yfinance: Used to download historical stock data.
- pandas: Used for data manipulation and analysis.
- matplotlib: Used for data visualization.
- scikit-learn: Used for data preprocessing (MinMaxScaler) and machine learning models (SVR).
- numpy: Used for numerical operations.
- tensorflow (keras): Used for building and training the LSTM neural network.
- lightgbm: Used for the LightGBM regressor model.
- streamlit: Used to create the interactive web application.
- The application is divided into two main sections: "Indicators" and "Machine Learning," accessible through tabs in the sidebar.
- The "Indicators" section calculates and displays common technical indicators.
- The "Machine Learning" section trains and evaluates LSTM, SVM, and LightGBM models for stock price prediction.
- Error handling is implemented to catch and display any exceptions that may occur during data retrieval or model training.
Like this project
Posted Mar 18, 2025
This project provides a user-friendly web application built with Streamlit to analyze stock prices and make predictions using ML + Indicators.