The network for creativity
Join 1.25M professional creatives like you
Connect with clients, get discovered, and run your business 100% commission-free
Creatives on Contra have earned over $150M and we are just getting started
Back to feedPost
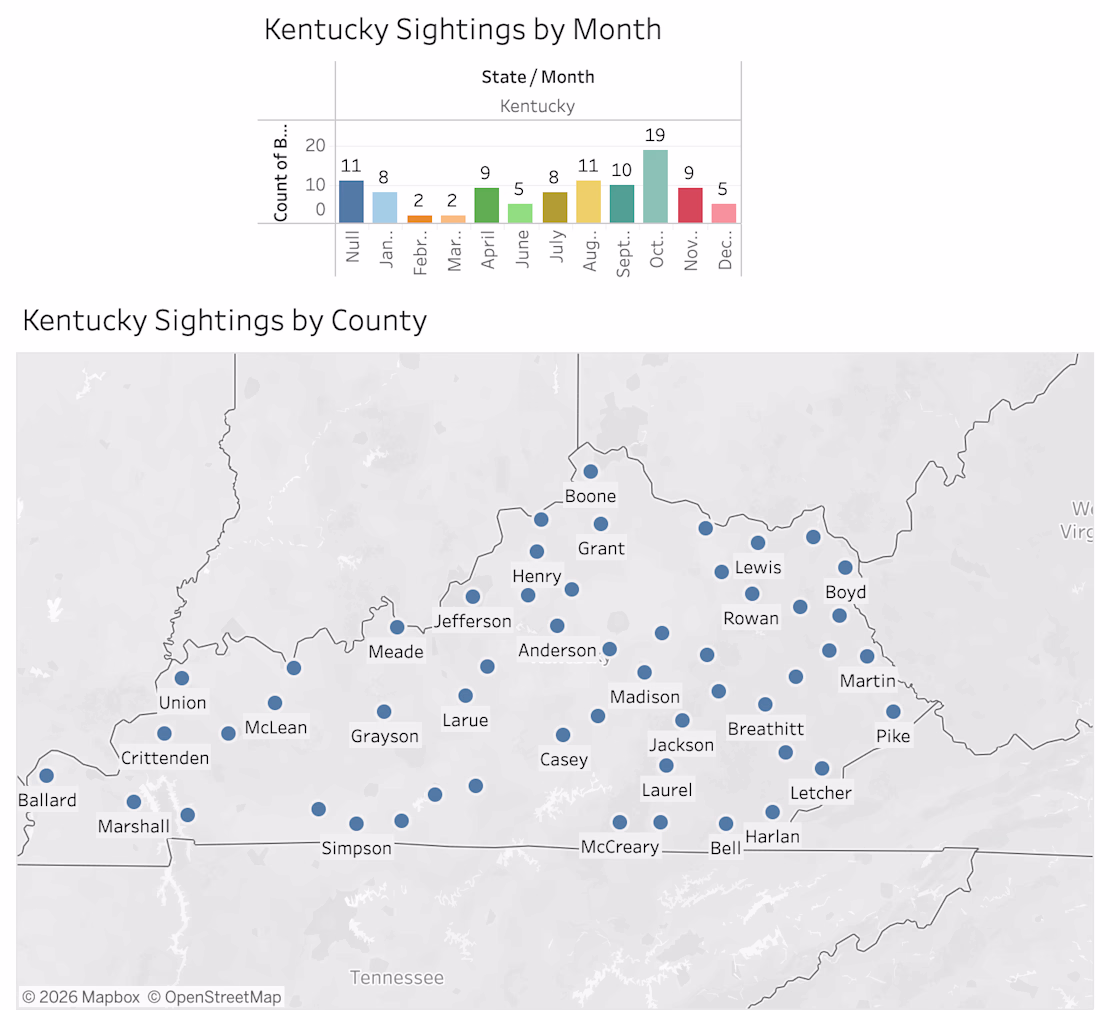
Created a Tableau dashboard to analyze geographic and temporal patterns in sightings data across Kentucky.
The analysis highlights monthly trends and the distribution of sightings by county, providing insights into location-based patterns and frequency over time.
This project demonstrates my ability to work with geospatial data and visualize trends effectively using Tableau
The network for creativity
Join 1.25M professional creatives like you
Connect with clients, get discovered, and run your business 100% commission-free
Creatives on Contra have earned over $150M and we are just getting started
Related posts
The next Palantir? Let’s not get ahead of ourselves 😂
But TerraScope is tackling a problem almost every operational team knows:
The information exists. It’s just scattered everywhere.
- Satellite imagery sits in one system.
- Field reports arrive through another.
- Public alerts move across social media.
- Environmental data lives on separate dashboards.
- And critical decisions are still coordinated through calls, messages and spreadsheets.
One situation. 10 tools. No shared picture.
So, I’ve been building TerraScope, a geospatial intelligence and coordination platform designed to bring these scattered signals into one operational picture.
Some current services includes
- Compare satellite imagery and monitor geographic change
- Map public reports, incidents and field evidence
- Track verification, confidence and source provenance
- Monitor environmental, agricultural and security-related signals
- Ask questions across collected evidence and get cited answers
- Create watch areas and operational alerts
- Coordinate Situation Rooms and field missions
- Produce decision briefs with a clear audit trail
The goal isn’t more data. It’s clearer decisions.
TerraScope helps teams see the same picture, understand what is known, keep uncertainty visible and coordinate the next action faster.
It could support teams working across:
- Emergency and disaster management
- Infrastructure and urban planning
- Agriculture and environmental monitoring
- Security and situational awareness
- Humanitarian operations
- State and local government coordination
It’s still evolving, but it’s starting to feel real.
Idea and the design is great with a sci fi approach and the presentation is flawless. Good work!
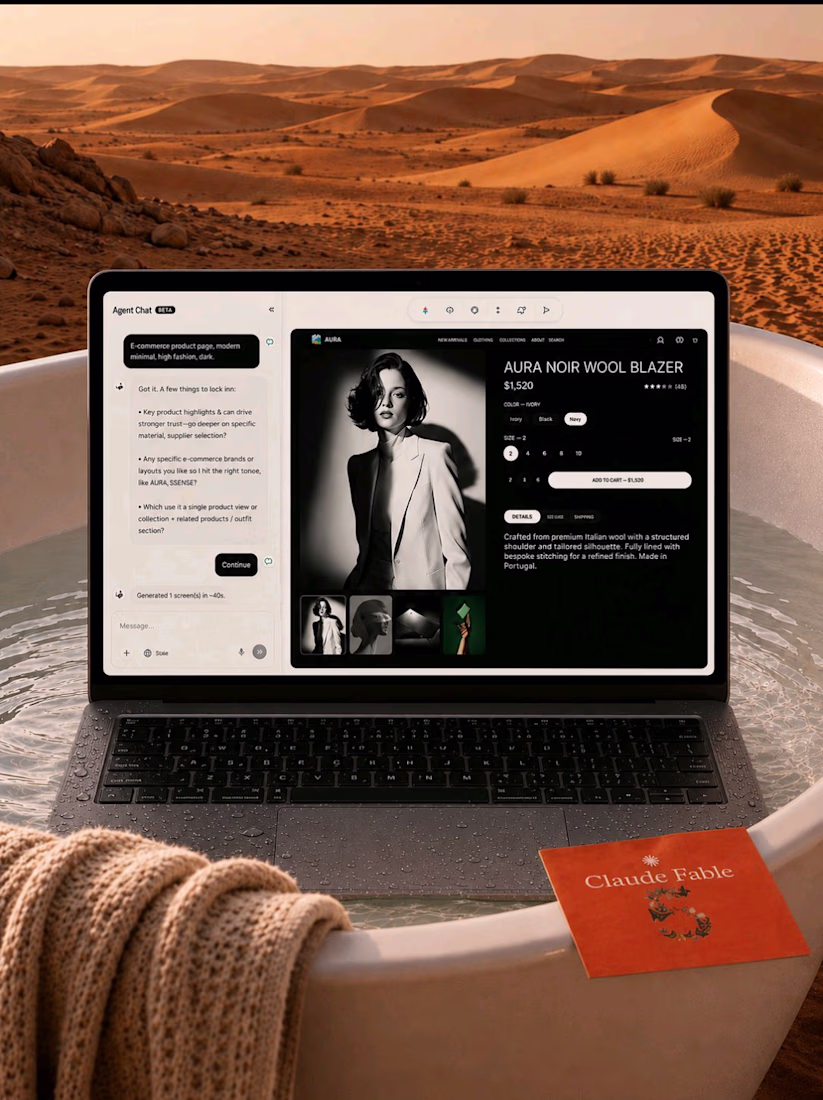
Everyone says AI will replace designers.
I think AI will replace boring work.
Designers who understand users, products, and visual storytelling will become even more valuable.
AI is my teammate.
Taste is still my superpower
That's how I design products—and that's the direction we're building with Inspo AI.
#UIUX #ProductDesign #ArtificialIntelligence #BuildInPublic #Contra #Startup
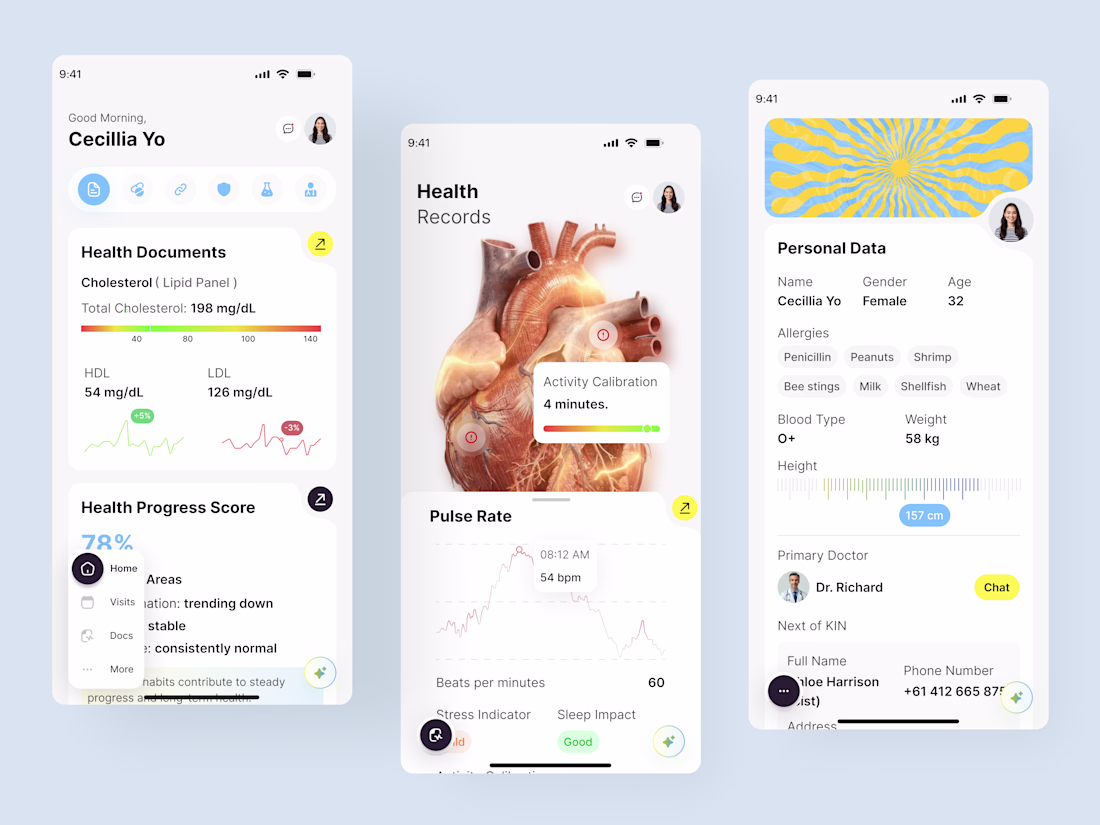
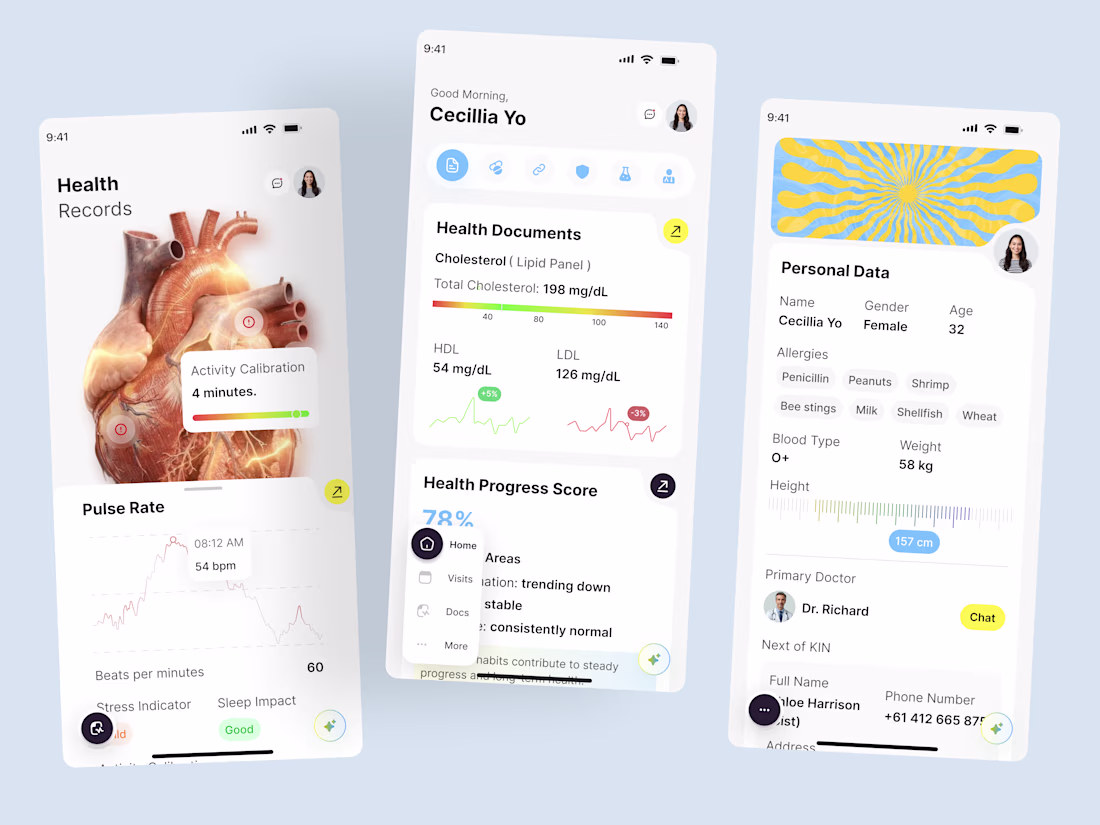
Healthcare should be accessible anytime, anywhere. This Healthcare Mobile App was designed to help users monitor health data, access wellness insights, and manage their healthcare journey through a simple and intuitive mobile experience. Built with a focus on usability, accessibility, and clear data visualization to support better health decisions.
📩 Open for new design collaborations.
Trending
Claude
Claude has entered the design space. How are you using Claude Design?
Contra University
Learn from expert creatives how to earn more using next-gen AI tools.
creativeaiflow
Creative AI workflows are evolving. What tools do you use, and what are their strengths and weaknesses?
freelancerlife
Freelancer life is wins, pivots, and everything in between. What’s yours right now?