
Buhle Biyela
Data Analyst | Excel & SQL | Data Cleaning and Insights.
New to Contra
Buhle is ready for their next project!
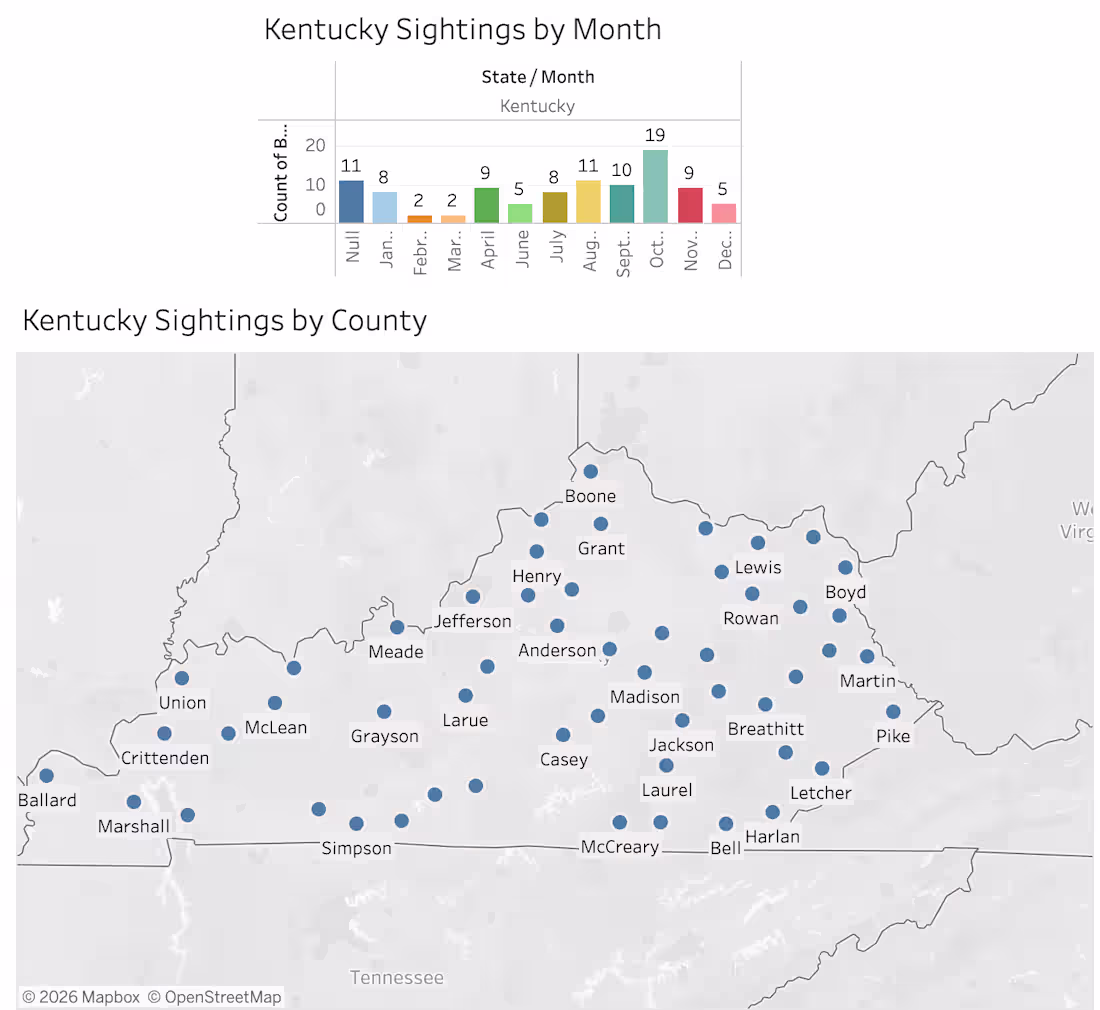
Created a Tableau dashboard to analyze geographic and temporal patterns in sightings data across Kentucky.
The analysis highlights monthly trends and the distribution of sightings by county, providing insights into location-based patterns and frequency over time.
This project demonstrates my ability to work with geospatial data and visualize trends effectively using Tableau
0
19
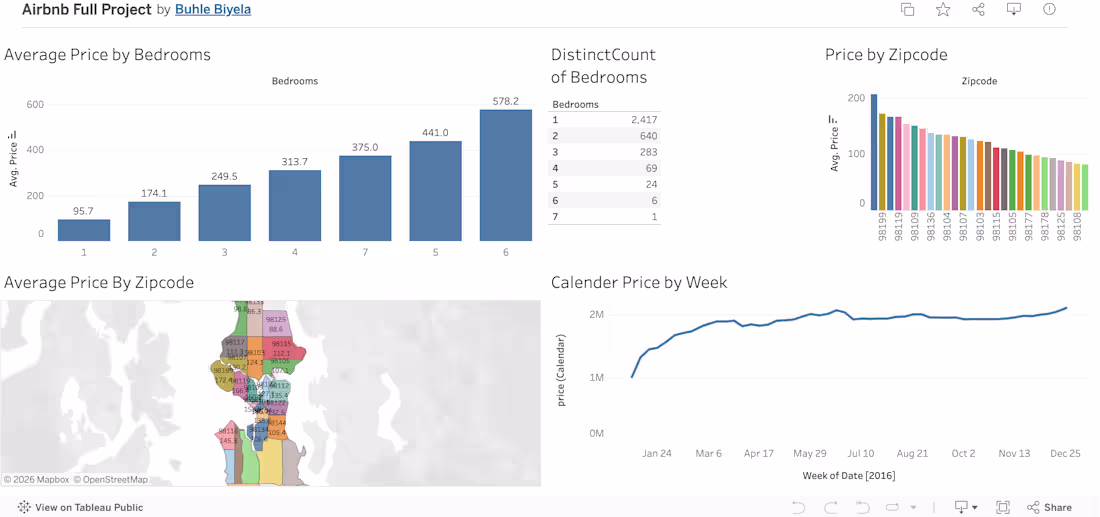
Developed an interactive Tableau dashboard to analyse Airbnb listing data, focusing on pricing trends, geographic distribution and property characteristics.
The dashboard highlights key insights such as average price by bedrooms, price variations by location and weekly pricing trends, enabling better understanding of the short-term rental market.
This project demonstrates my ability to visualise complex data and communicate insights effectively using Tableau.
0
23
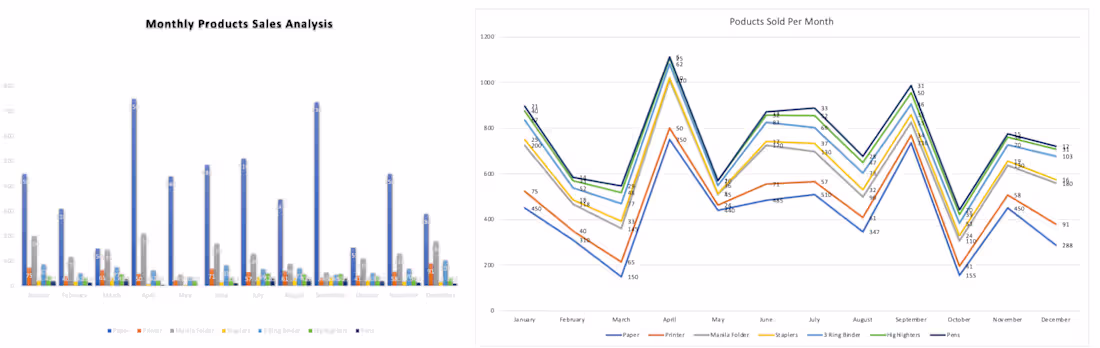
Analyzed monthly product sales data to identify trends and performance across multiple product categories.
Created clear visualisations to highlight sales patterns, peak periods and product comparisons, enabling better understanding of business performance.
This project demonstrates my ability to transform raw data into meaningful insights using Excel.
0
25
Analysed monthly product sales data to identify trends and performance across multiple product categories.
Created clear visualizations to highlight sales patterns, peak periods and product comparisons, enabling better understanding of business performance.
This project demonstrates my ability to transform raw data into meaningful insights using Excel.
0
30