The network for creativity
Join 1.25M professional creatives like you
Connect with clients, get discovered, and run your business 100% commission-free
Creatives on Contra have earned over $150M and we are just getting started
Back to feedPost

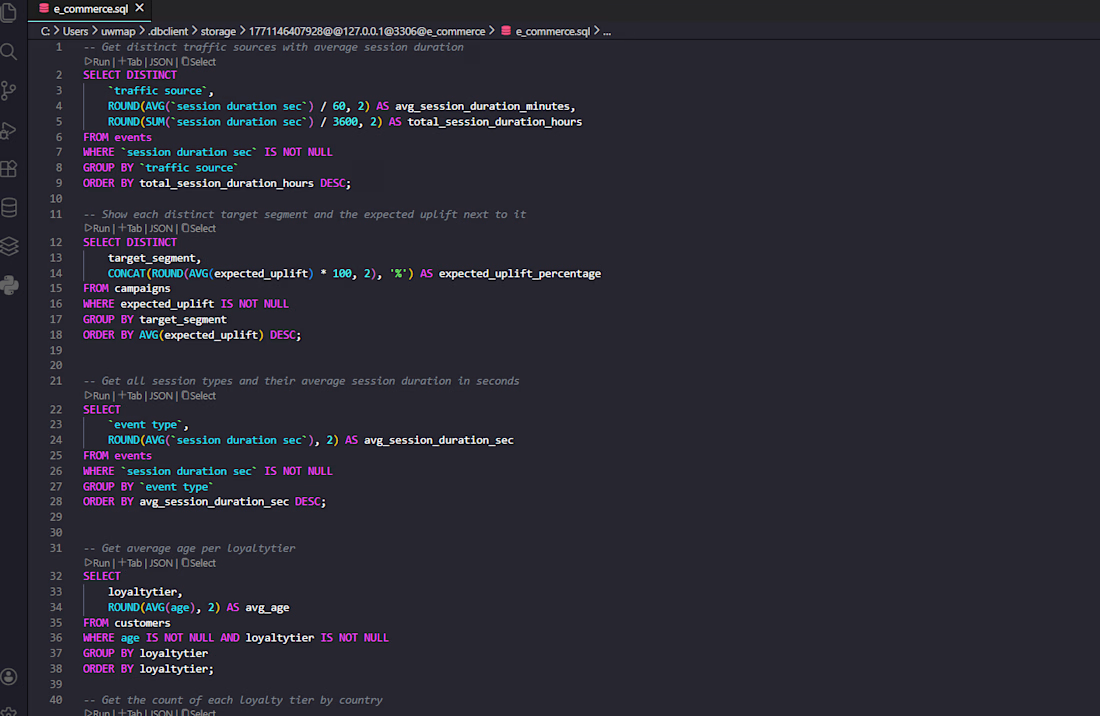
Behind every great dashboard is a clean query. I’m currently using SQL to transform raw event logs into actionable intelligence for an e-commerce build.
Key Metrics Extracted:
Traffic Quality: Identifying high-intent sources via avg_session_duration.
Campaign ROI: Using expected_uplift to pinpoint winning customer segments.
Behavioral Trends: Mapping friction points in the checkout funnel.
Moving from "gut feelings" to real-time data in Power BI, Tableau, and Looker Studio.



The network for creativity
Join 1.25M professional creatives like you
Connect with clients, get discovered, and run your business 100% commission-free
Creatives on Contra have earned over $150M and we are just getting started

Challenges
View all


Related posts

Real Estate Analytics & Listing Dashboard
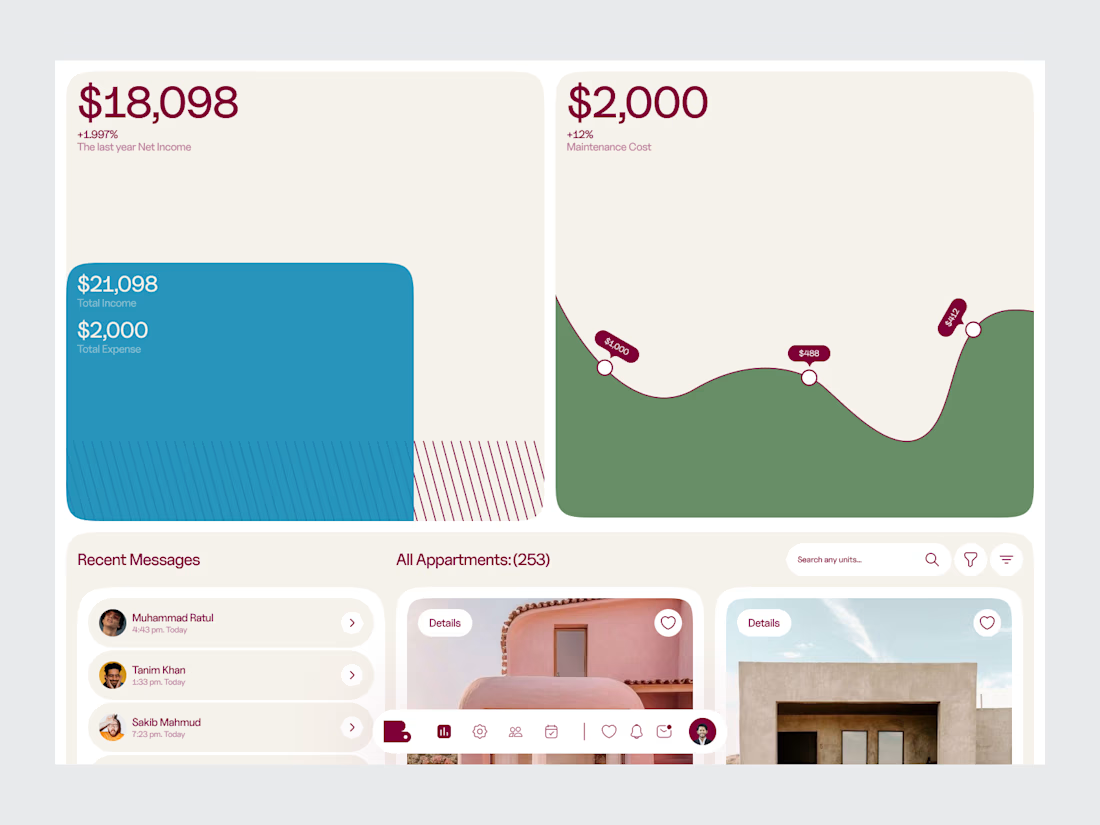
A PropTech dashboard concept combining property listing management with real estate analytics.
The workspace is structured around the information a real estate team needs to monitor and act on — property inventory, listing activity, performance metrics and business insights.
The design approach puts hierarchy first, keeping a data-heavy product organized without making it feel overwhelming.
Design focus:
• Real Estate SaaS
• Analytics Dashboard
• Property Listing Management
• Data Visualization
• PropTech UI/UX
• Product Design
• Business Intelligence
Designed by WaxyWeb.


Nice

📊 Turning Data Into Insights
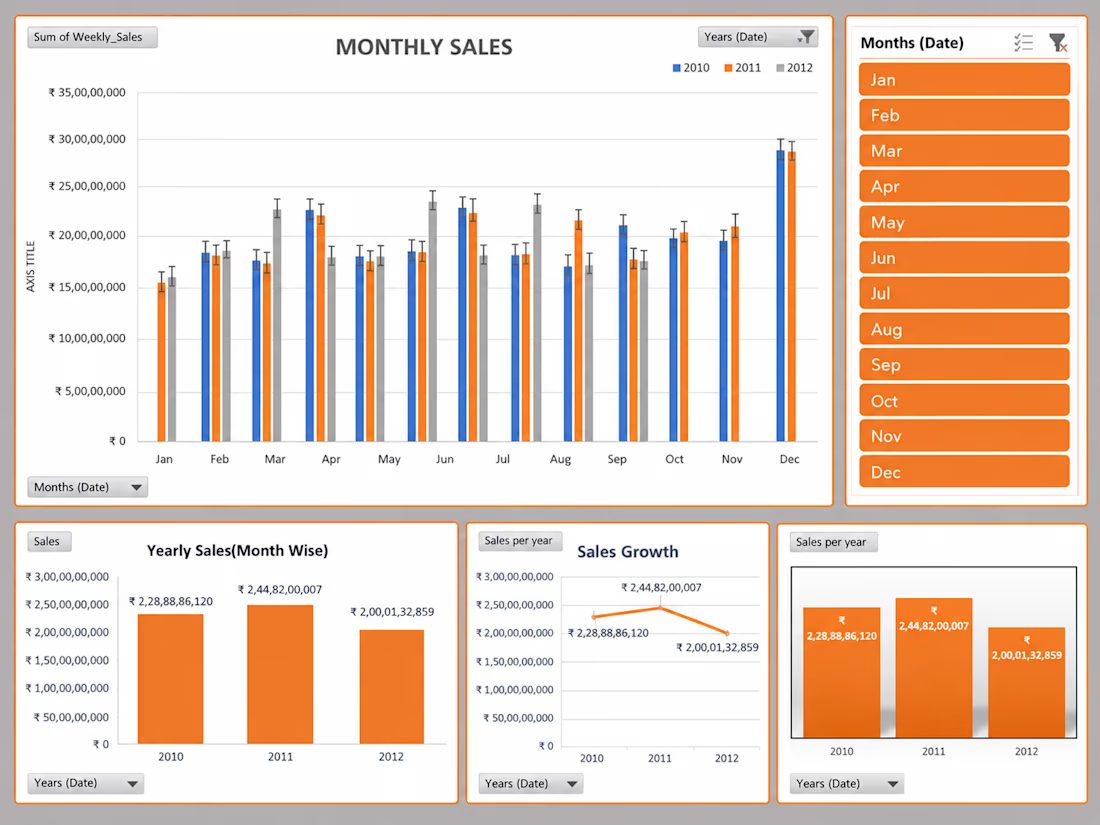
Sharing one of my recent Power BI dashboard projects.
I worked on transforming raw data into an interactive dashboard with a focus on:
• Data cleaning & transformation
• KPI tracking
• Interactive visualizations
• DAX calculations
• Trend & performance analysis
🛠️ Tools: Power BI • Power Query • DAX • Excel
Still learning, building, and improving with every project. 🚀
#PowerBI #DataAnalytics #DataVisualization #DAX #BusinessIntelligence #DataAnalyst #Analytics #Dashboard


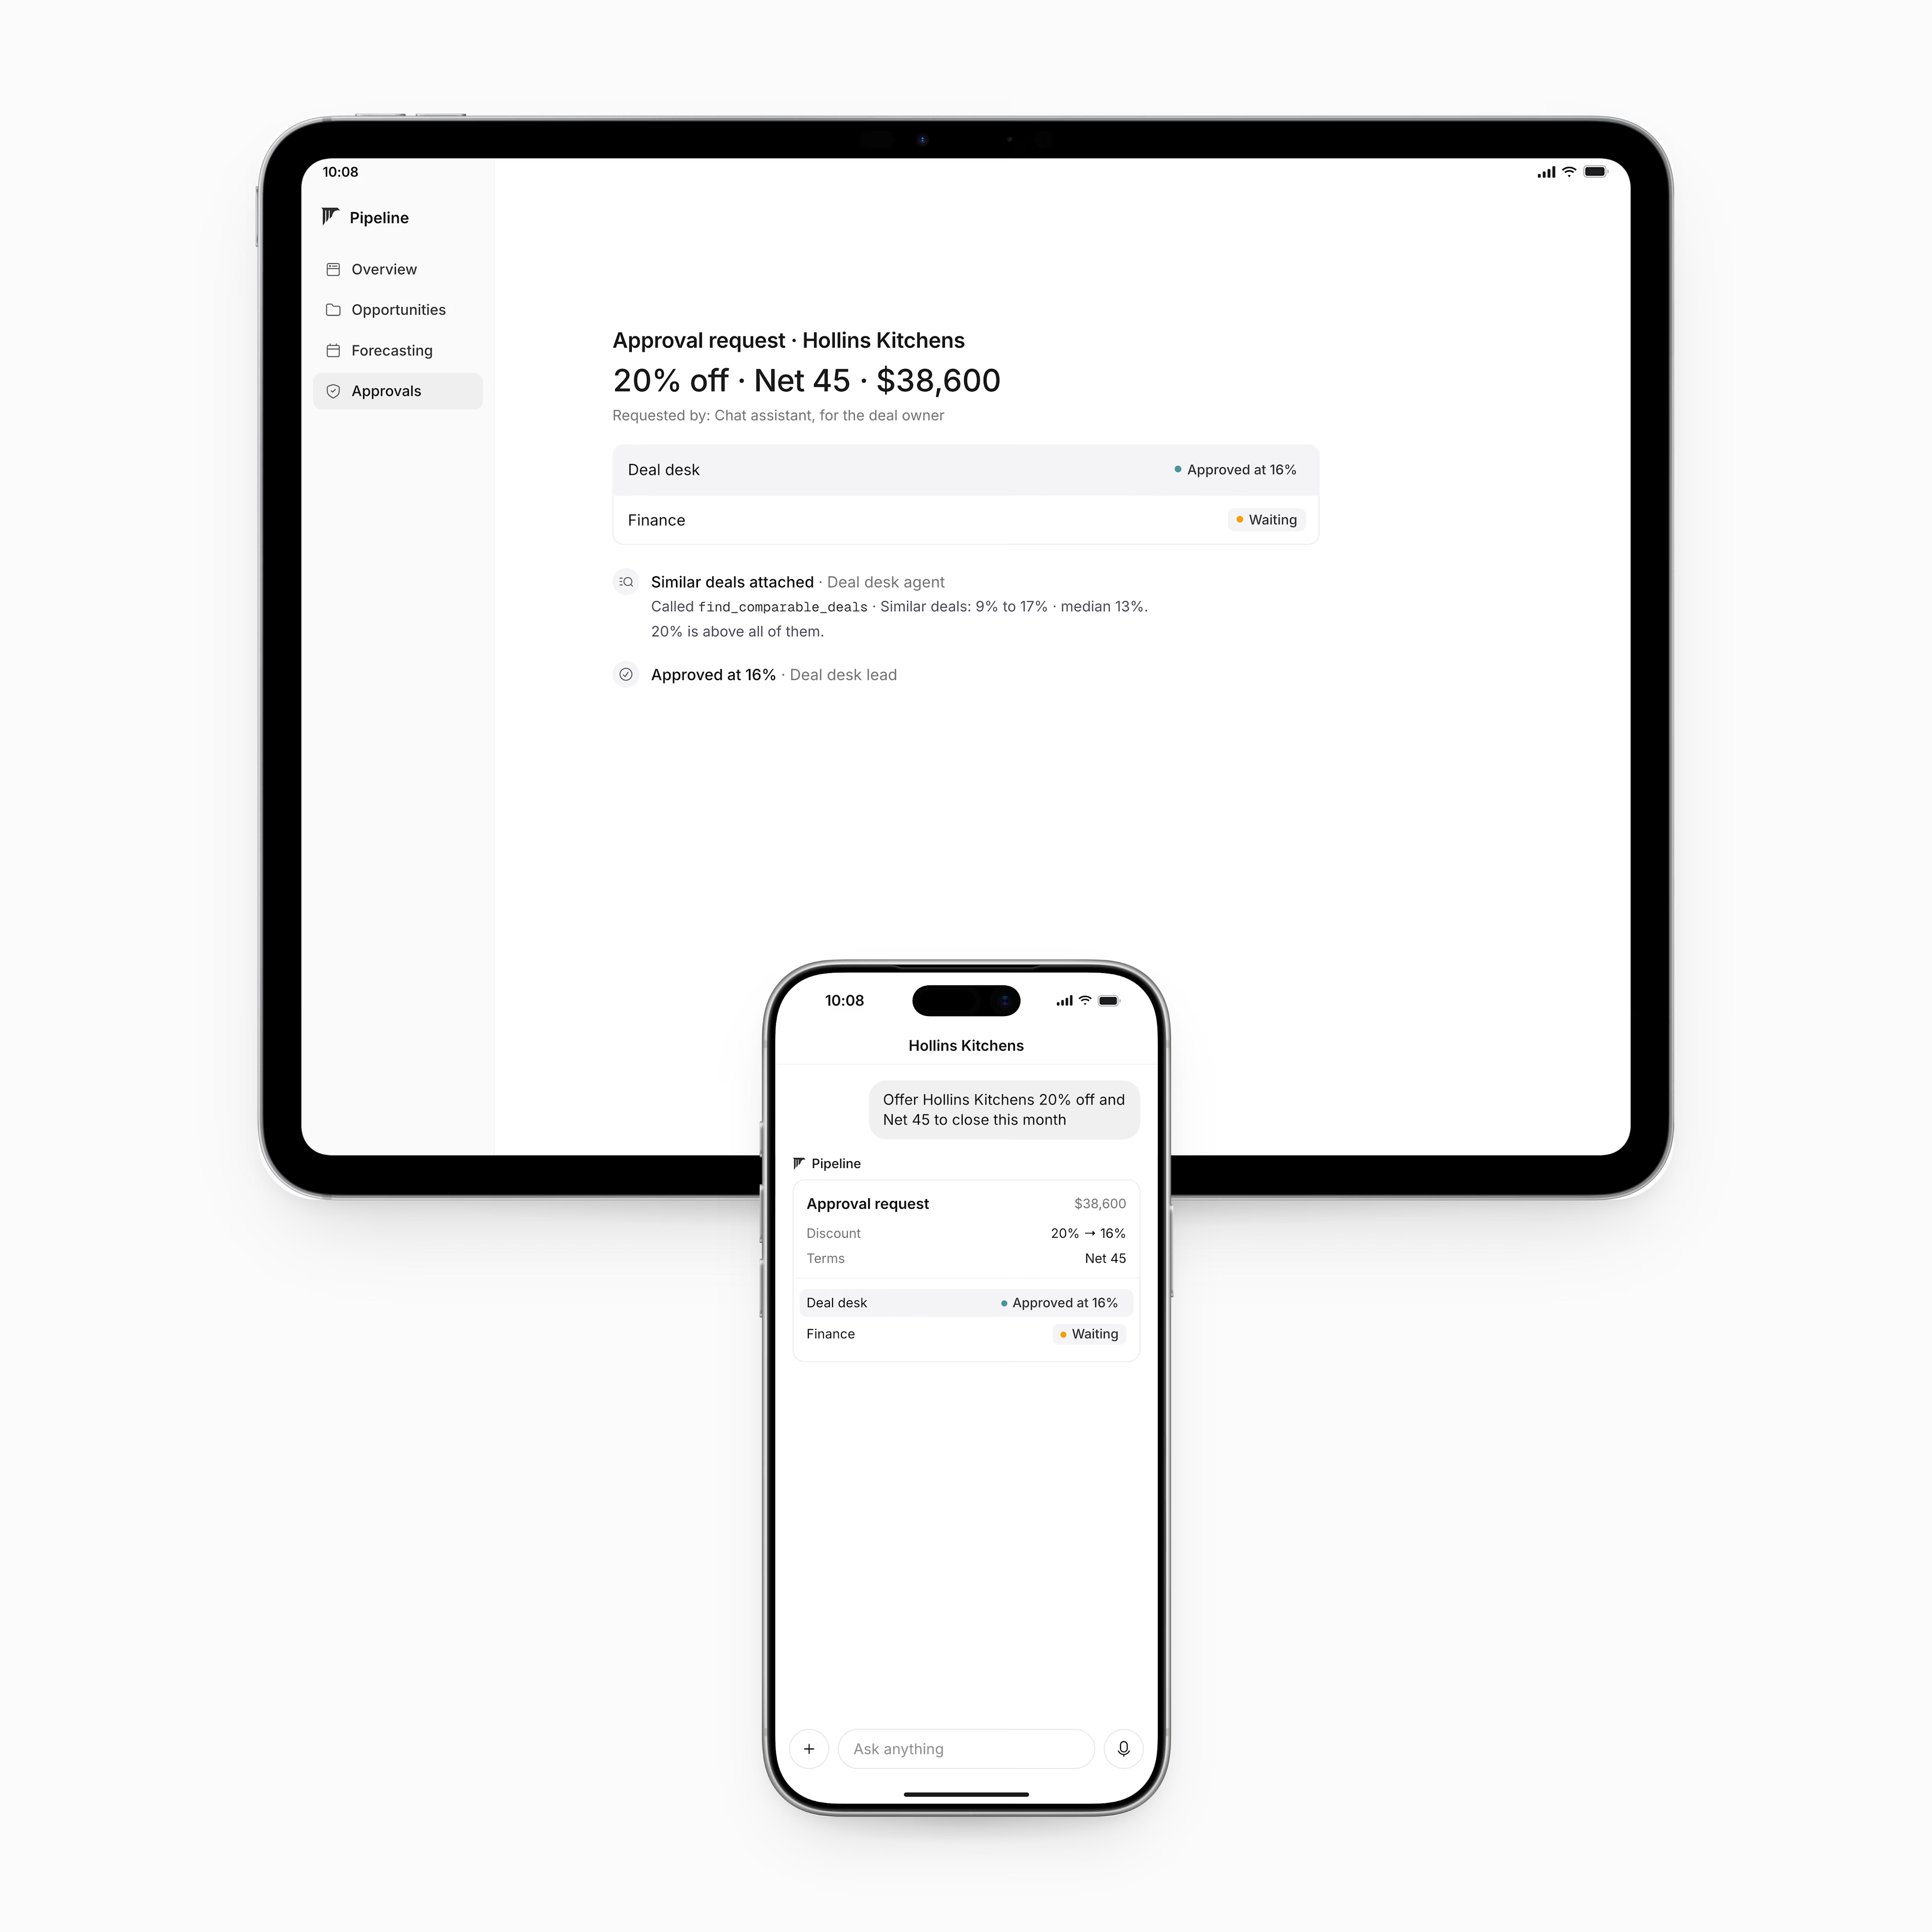
Dashboard and MCP request design for sales platform
The goal was the keep the experience simple for the users. Dashboards contain the majority of the information while the MCP request flags what's needed.
Check it out


I love this clean design 😍