The network for creativity
Join 1.25M professional creatives like you
Connect with clients, get discovered, and run your business 100% commission-free
Creatives on Contra have earned over $150M and we are just getting started
Back to feedPost

Developed a comprehensive, 10-page interactive Power BI Executive Dashboard for "Altitude Outfitters" (a multi-channel, multi-currency outdoor retail company operating across 8 countries). The goal was to transform 17 raw, messy tables (~146K order lines) into an automated decision-making tool for leadership.
Key Features & Technical Highlights:
• Data Cleaning & ETL (Power Query): Cleaned dirty data, handled missing values, removed duplicates, and standardized multi-format dates and currencies using custom M-code.
• Data Modeling: Designed a robust Star/Snowflake Schema resolving complex relationships and multi-granularity facts (daily marketing spend, weekly sessions, monthly targets, and order-level sales).
• Advanced DAX: Created 50+ measures including dynamic Currency Conversion (Local to USD + Constant Currency FX Impact), Time Intelligence (YTD, YoY), Contribution Margin Waterfall, and Customer Acquisition Cost (CAC).
• Deep-Dive Analytics: Built Customer Cohort Retention Heatmaps, RFM Segmentation, Pareto (80/20) Analysis, Marketing Funnel, and an Inventory Health Quadrant (Days of Cover vs. Sales Velocity).
• Premium UI/UX Design: Applied a custom JSON dark theme, Field Parameters (dynamic metric switching), 'What-If' scenario sliders for target forecasting, Custom Tooltips, and a seamless Master-Detail drill-through experience using Bookmarks.
(Note: Fictional dataset created for portfolio demonstration purposes).


The network for creativity
Join 1.25M professional creatives like you
Connect with clients, get discovered, and run your business 100% commission-free
Creatives on Contra have earned over $150M and we are just getting started


Related posts

Road Safety Analysis | Python, SQL & Power BI
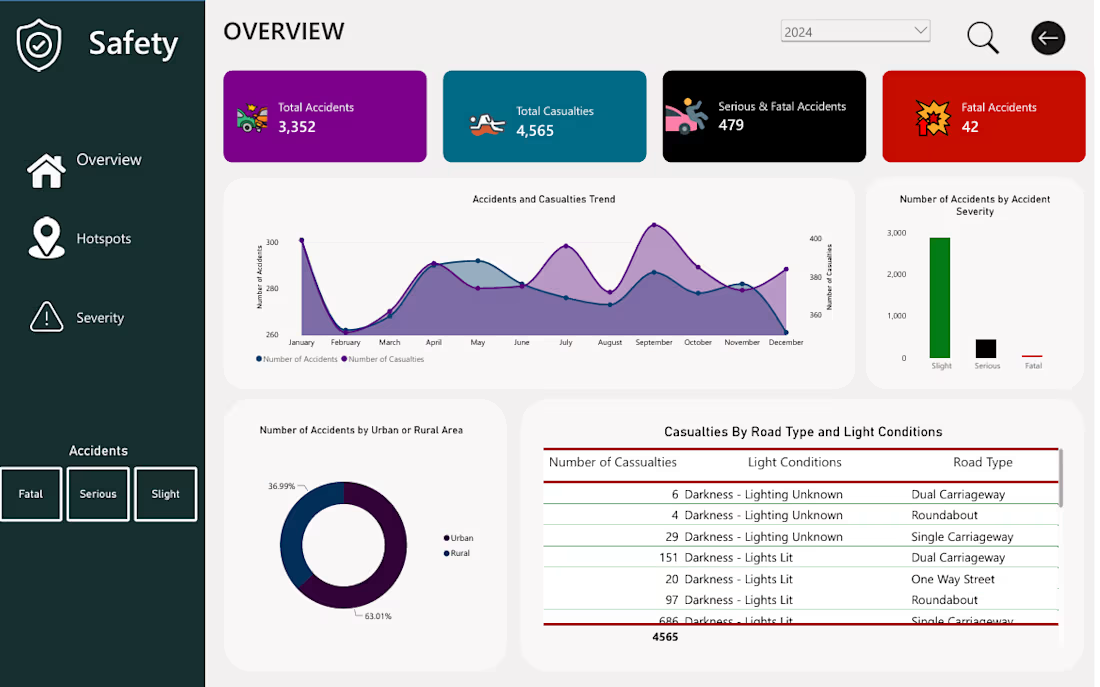
Developed an end-to-end road safety analytics project to help authorities understand accident patterns, identify high-risk areas, and make informed decisions about road safety interventions.
The project involved cleaning and preparing road accident data using Python and Pandas, followed by SQL-based exploratory analysis to investigate accident trends, casualty figures, severity distributions, and geographical patterns.
Using Power BI, I transformed the findings into an interactive dashboard featuring key performance indicators and visualisations that provide an overview of accident activity, highlight trends over time, and reveal differences in accident occurrence across districts and locations.
The analysis also explored accident severity in relation to road types, weather conditions, lighting, and road surface conditions.
Tools used: Python, Pandas, SQL, Power BI.
Project deliverable: An interactive Power BI dashboard supported by data cleaning, transformation, and SQL analysis.
The objective was to turn raw accident data into clear, meaningful insights that can support evidence-based road safety planning and resource prioritisation.


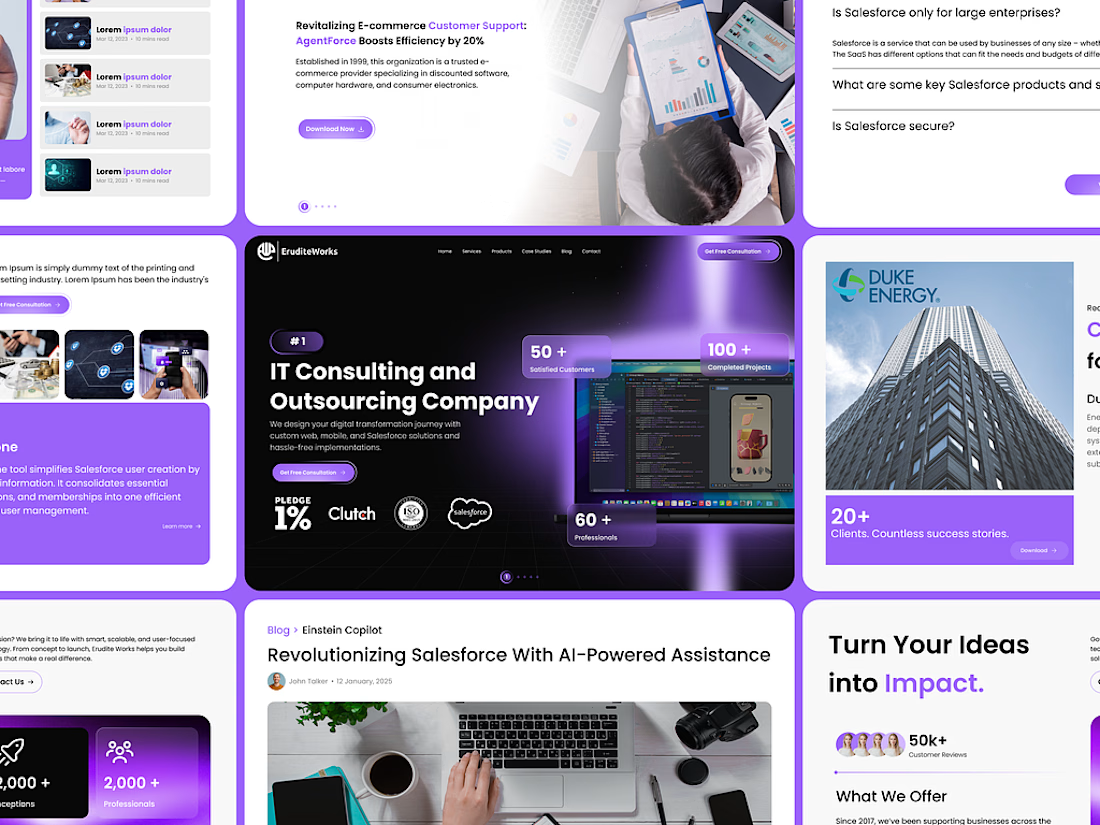
Designed a high-converting, premium enterprise landing page for EruditeWorks, an IT consulting and outsourcing firm.
The Problem: Many corporate tech websites feel flat, text-heavy, and fail to immediately convey tech authority or client trust metrics.
The Solution: I engineered a layout that balances visual richness with strategic information architecture:
• Structured a high-impact hero header featuring validation metrics (100+ Completed Projects, 60+ Professionals).
• Implemented seamless trust badges underneath the core value proposition.
• Created visually engaging secondary layouts for client success stories, AI tools (Einstein Copilot), and intuitive FAQ components.
• Maintained an authoritative yet bleeding-edge aesthetic using a dark palette with premium glowing gradients.
Deliverables included full high-fidelity desktop UI designs and a responsive component system ready for developer handoff.



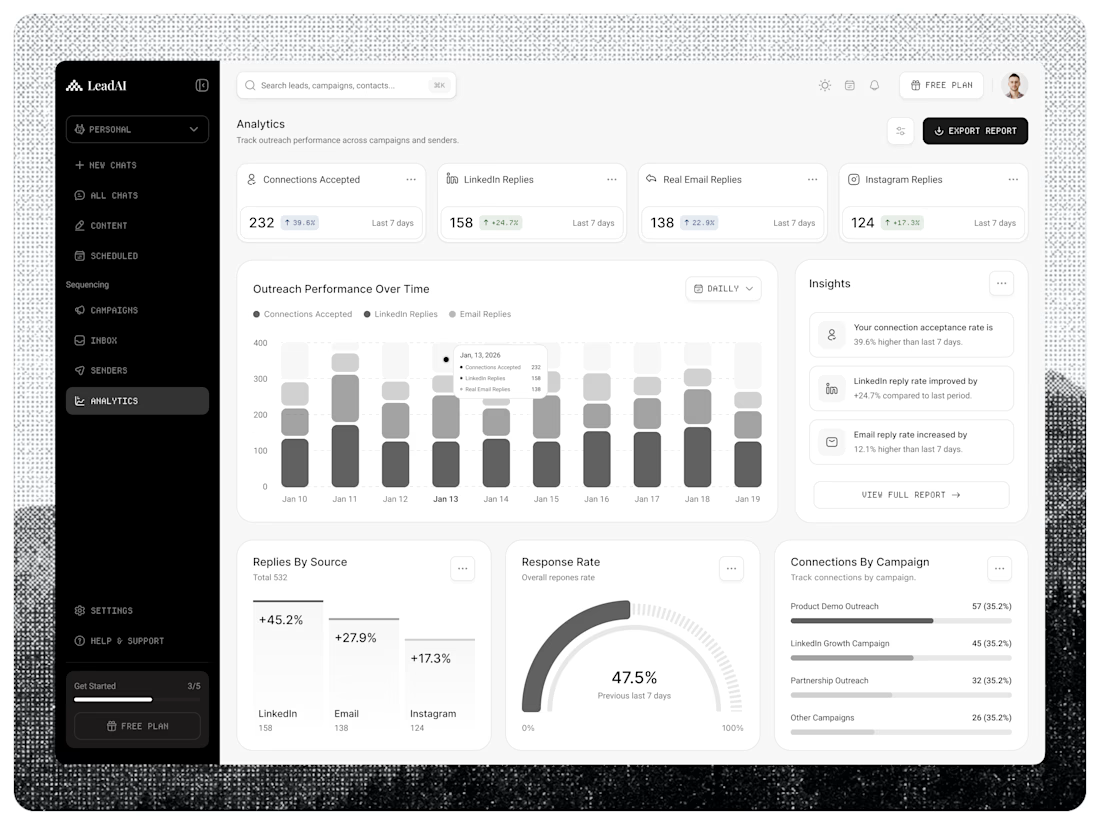
AI-Powered Prospecting SaaS Platform | Analytics Dashboard
LeadAI — AI-Powered Prospecting SaaS Platform A modern AI-powered prospecting platform designed to help sales teams discover high-quality leads, automate outreach, manage campaigns, and turn prospects into opportunities.
The experience combines AI assistance, lead generation, email & LinkedIn outreach, campaign management, analytics, and smart sales workflows into one clean, intuitive SaaS platform.
Designed for: SaaS Founders, Sales Teams, Growth Teams & B2B Businesses.
Focus: AI • Lead Generation • Sales Automation • CRM • SaaS • Dashboard • UI/UX • Product Design Designed with Figma. Interested in building a modern SaaS, AI product, CRM, dashboard, or B2B web application?
Available for UI/UX & AI Product Design projects. 🎯
✅ Full-Time | Contract | Remote