The network for creativity
Join 1.25M professional creatives like you
Connect with clients, get discovered, and run your business 100% commission-free
Creatives on Contra have earned over $150M and we are just getting started
Back to feedPost

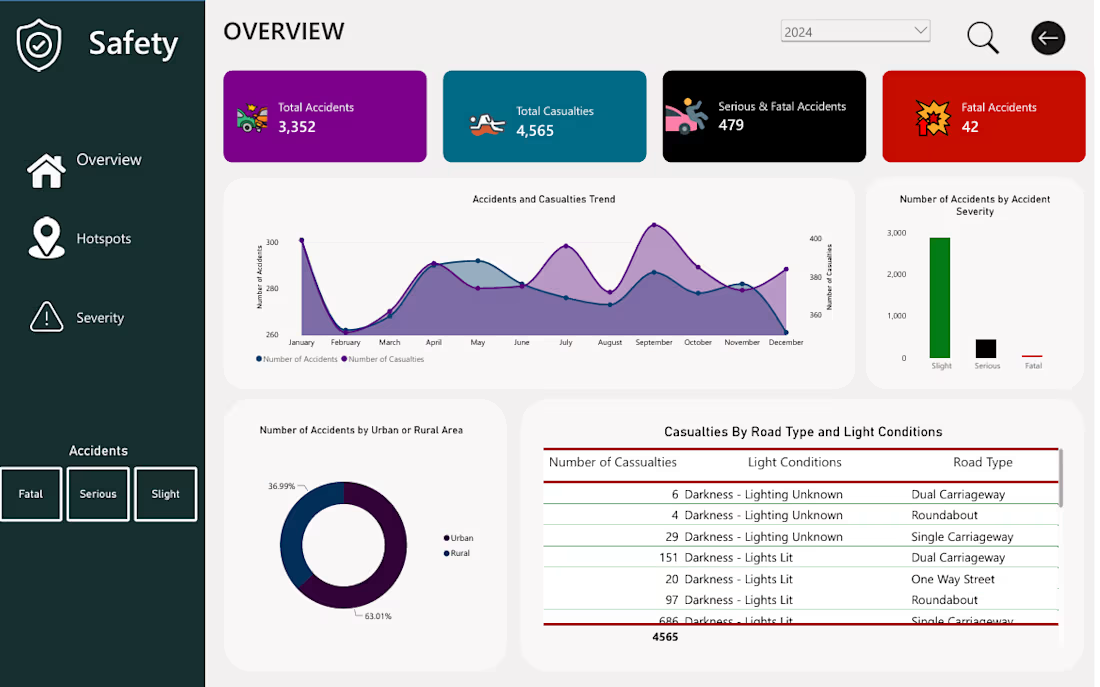
Road Safety Analysis | Python, SQL & Power BI
Developed an end-to-end road safety analytics project to help authorities understand accident patterns, identify high-risk areas, and make informed decisions about road safety interventions.
The project involved cleaning and preparing road accident data using Python and Pandas, followed by SQL-based exploratory analysis to investigate accident trends, casualty figures, severity distributions, and geographical patterns.
Using Power BI, I transformed the findings into an interactive dashboard featuring key performance indicators and visualisations that provide an overview of accident activity, highlight trends over time, and reveal differences in accident occurrence across districts and locations.
The analysis also explored accident severity in relation to road types, weather conditions, lighting, and road surface conditions.
Tools used: Python, Pandas, SQL, Power BI.
Project deliverable: An interactive Power BI dashboard supported by data cleaning, transformation, and SQL analysis.
The objective was to turn raw accident data into clear, meaningful insights that can support evidence-based road safety planning and resource prioritisation.


The network for creativity
Join 1.25M professional creatives like you
Connect with clients, get discovered, and run your business 100% commission-free
Creatives on Contra have earned over $150M and we are just getting started
Related posts

This interactive dashboard provides a comprehensive view of profit performance across multiple dimensions—time, segments, regions, categories, and sub‑categories.
This dashboard transforms raw business data into actionable insights by allowing stakeholders to quickly identify profitable areas, spot regional trends, and evaluate category performance. It’s designed for clarity, interactivity, and decision‑making support.

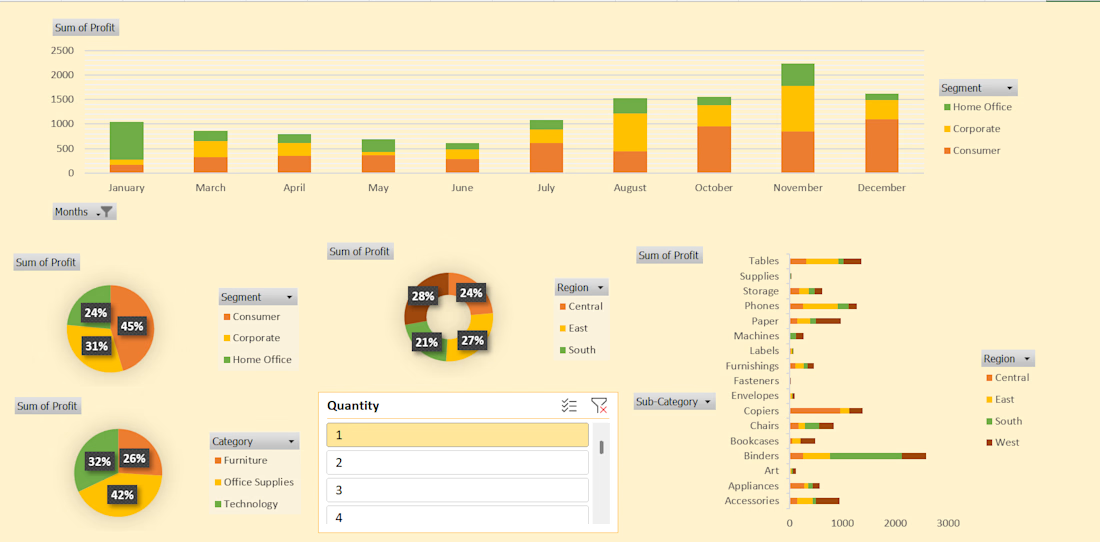
#This is an excellent Profit Dashboard which is made in MS Excel with multiple creative functions help in understanding Monthly , Yearly , Area wise Profits.

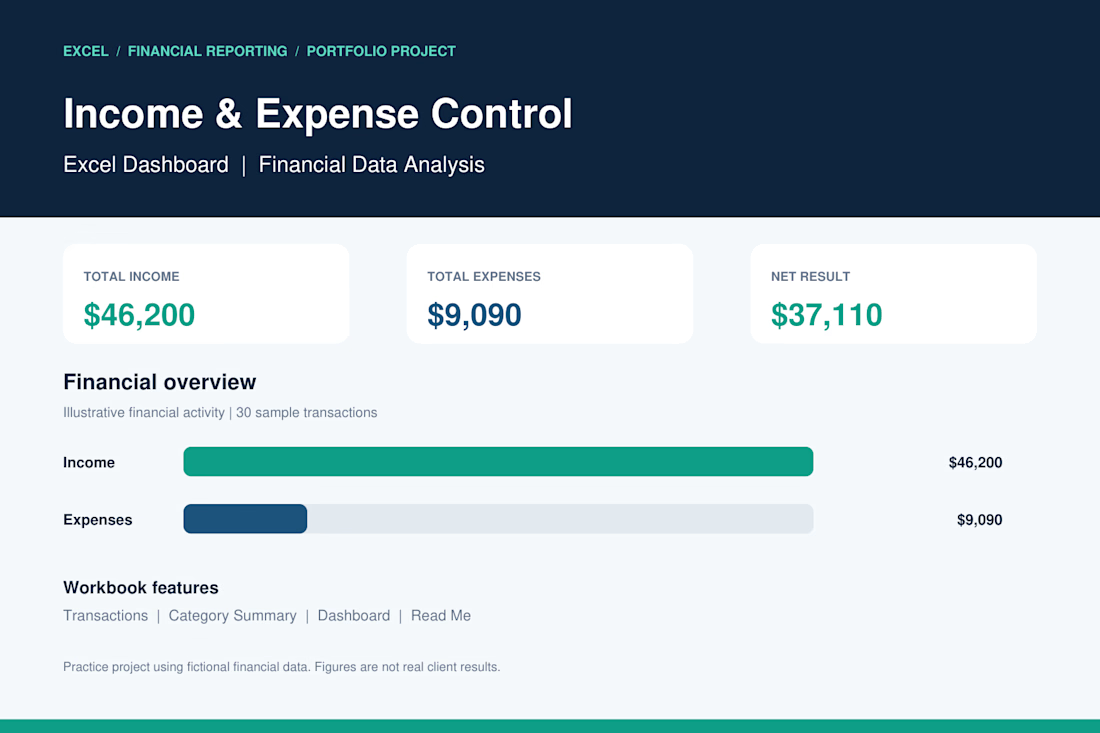
Income & Expense Control | Excel Dashboard
I developed a professional Excel dashboard as a portfolio practice project to demonstrate my skills in financial data management, income and expense tracking, and business reporting.
Project Features:
Automated income and expense calculations.
Financial dashboard with key performance indicators (KPIs).
Transaction tracking and organization.
Expense analysis by category.
Financial charts and visual reporting.
Net income calculation.
Project Results (Sample Data):
Total Income: $46,200
Total Expenses: $9,090
Net Result: $37,110
Tools: Microsoft Excel
Skills: Data Analysis, Accounting, Financial Reporting, Data Entry.
This project demonstrates my ability to organize financial records, analyze business performance, and create clear financial reports using Microsoft Excel.
Note: This is a portfolio demonstration using fictional financial data.

Great work 👏🏻

Having trouble deciding on the final material palette? Take a look at our latest case study showing how we helped test different kitchen finishes in 3D - from swapping range hoods to testing bold versus neutral backsplashes. Check out the full project on my profile to see how visualization speeds up design approvals!