The network for creativity
Join 1.25M professional creatives like you
Connect with clients, get discovered, and run your business 100% commission-free
Creatives on Contra have earned over $150M and we are just getting started
Back to feedPost
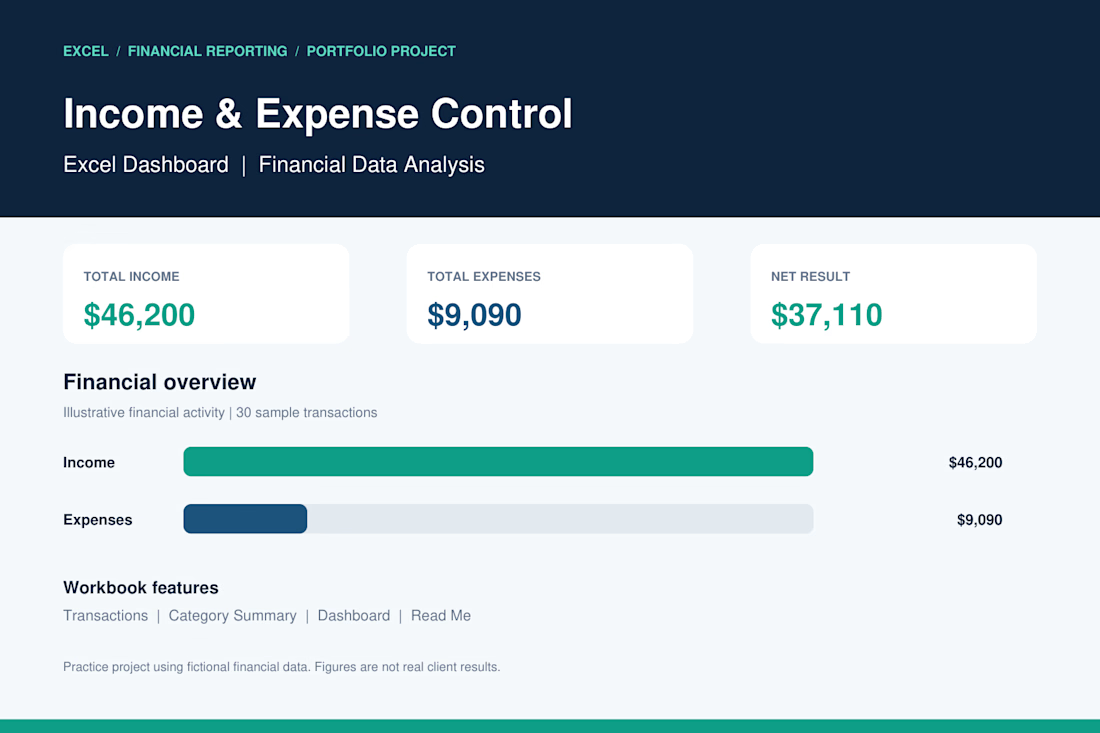
Income & Expense Control | Excel Dashboard
I developed a professional Excel dashboard as a portfolio practice project to demonstrate my skills in financial data management, income and expense tracking, and business reporting.
Project Features:
Automated income and expense calculations.
Financial dashboard with key performance indicators (KPIs).
Transaction tracking and organization.
Expense analysis by category.
Financial charts and visual reporting.
Net income calculation.
Project Results (Sample Data):
Total Income: $46,200
Total Expenses: $9,090
Net Result: $37,110
Tools: Microsoft Excel
Skills: Data Analysis, Accounting, Financial Reporting, Data Entry.
This project demonstrates my ability to organize financial records, analyze business performance, and create clear financial reports using Microsoft Excel.
Note: This is a portfolio demonstration using fictional financial data.


Great work 👏🏻

“Thank you! We're always happy to help.”
The network for creativity
Join 1.25M professional creatives like you
Connect with clients, get discovered, and run your business 100% commission-free
Creatives on Contra have earned over $150M and we are just getting started



Related posts

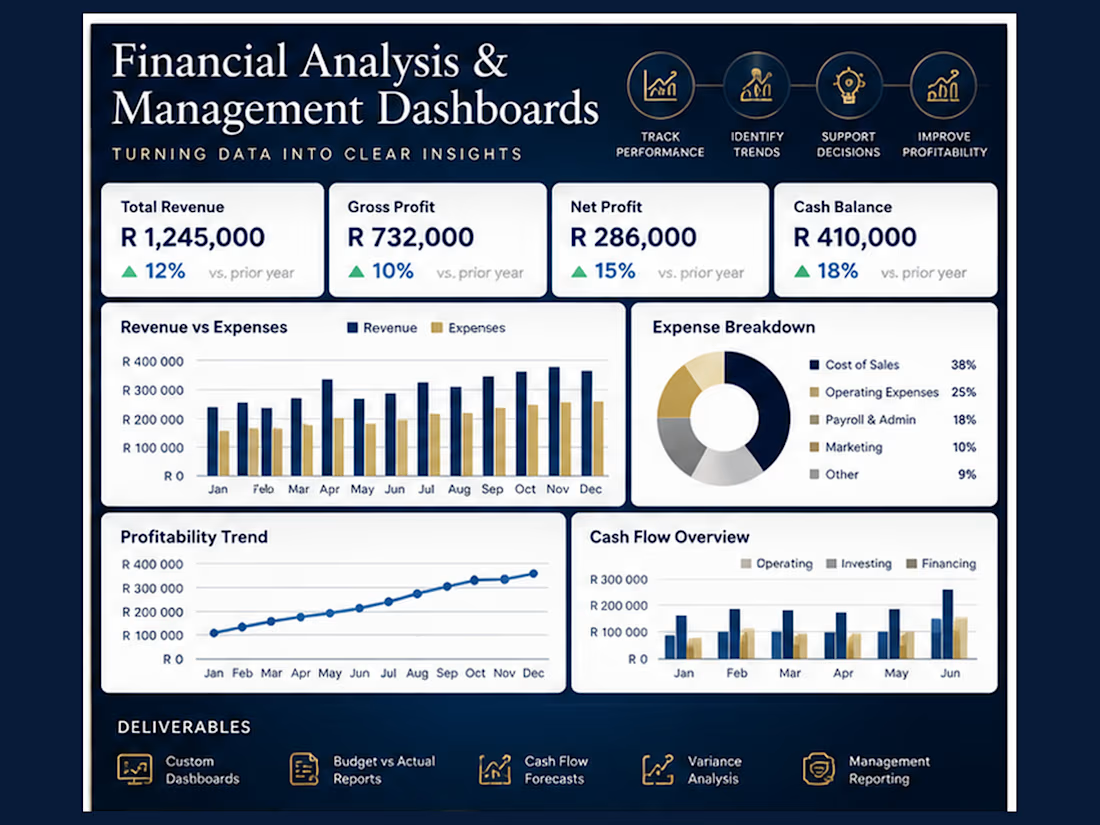
Financial Analysis & Management Dashboards
I help businesses transform financial information into clear, actionable insights through structured financial analysis, management reporting, and interactive dashboards.
My experience includes preparing financial reports, analysing income and expenditure, reviewing profitability, monitoring cash flow, and identifying financial discrepancies and trends.
Key services include:
Financial performance analysis and KPI reporting
Revenue, expense, and profitability analysis
Budget versus actual reporting
Cash-flow forecasting and monitoring
Excel dashboards and automated reporting
Management reports and variance analysis
I combine practical accounting knowledge with analytical tools to help businesses improve financial visibility and make informed decisions.
Portfolio note: The accompanying dashboard is an illustrative demonstration using sample financial information. No confidential client data is included.



Challenge
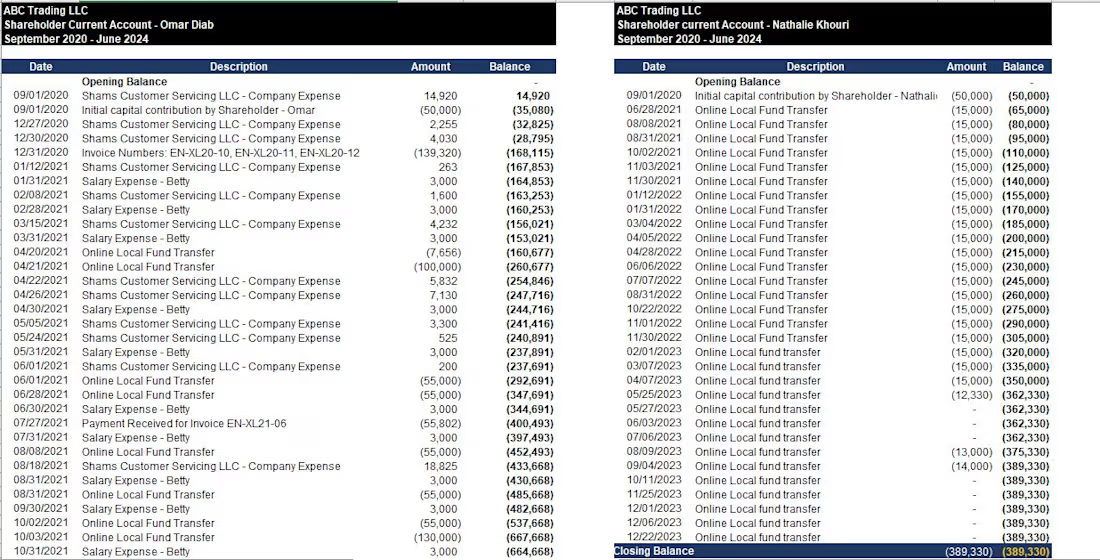
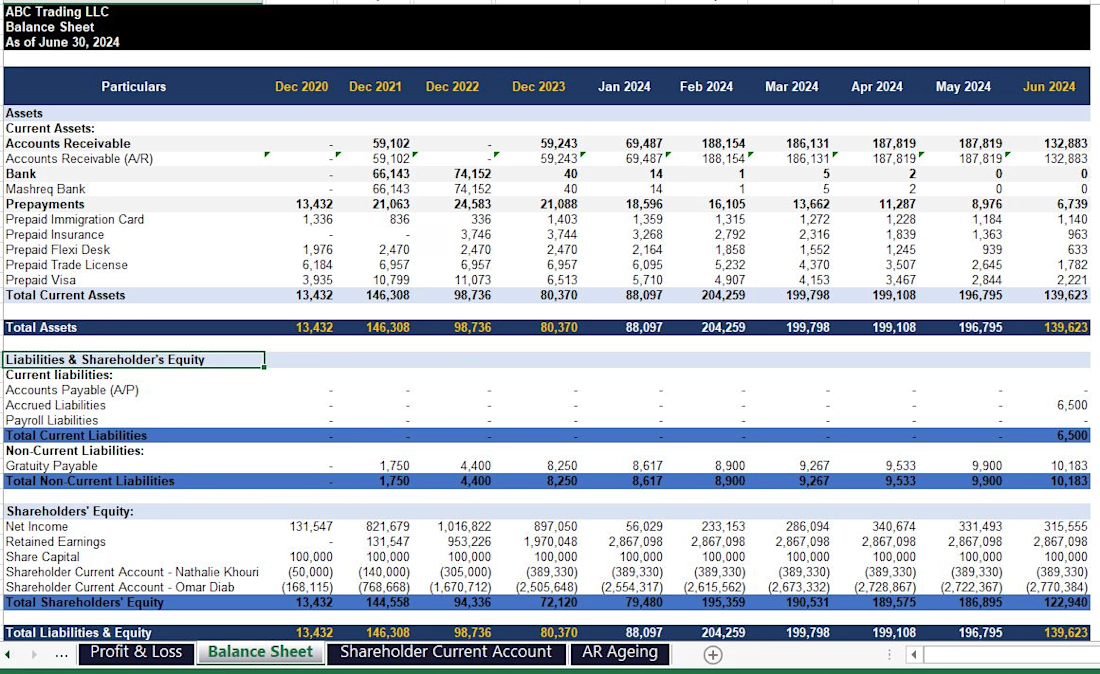
A director approached me wanting full visibility of personal transactions made through the company’s bank account. Personal and business spending had been mixed, making it hard to see what belonged to whom. He needed to know exactly where his money went, without it distorting the company’s financial position.
Solution
I reviewed the full bank statements and identified every personal transaction. Each one was categorised and recorded against the director’s personal account, keeping it separate from the company’s balance. Company transactions were left untouched, so the business accounts stayed accurate. I then prepared a clear, transaction-by-transaction report showing dates, amounts, payees and the running balance.
Result
The director received an in-depth view of every personal spend, with a clean separation from company funds. This gave him clarity over his own balance, supported accurate company books, and made future reporting and tax compliance simpler. It also gave him a clear record to refer back to whenever questions arise.
Services: Bookkeeping, Management Reports


very organzied way to record all transactions.
Developed a management accounts reporting process designed to help businesses understand their financial performance and make informed business decisions.
Good going fatimaa😍