Results that are similar to your search
Similar results
Senior .NET Fullstack Developer
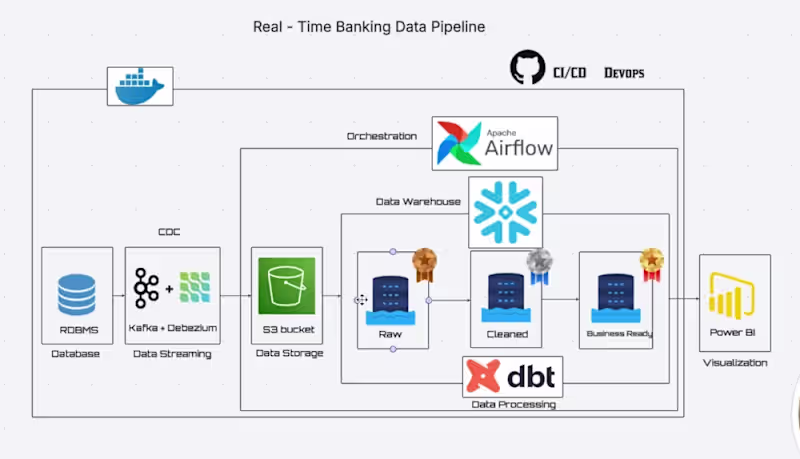
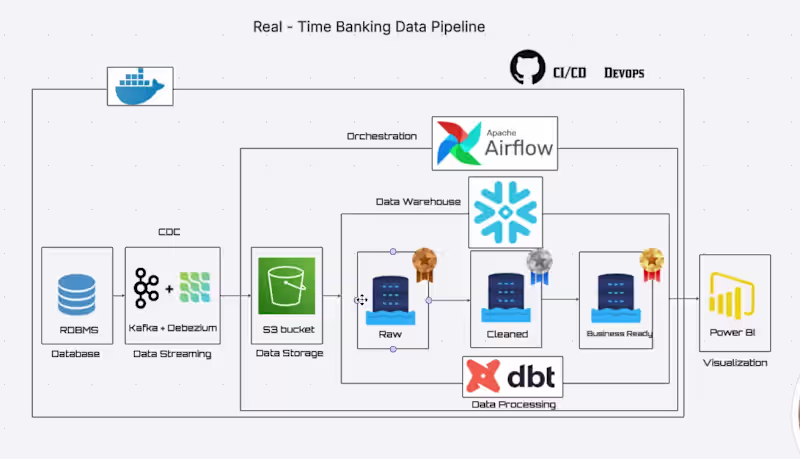
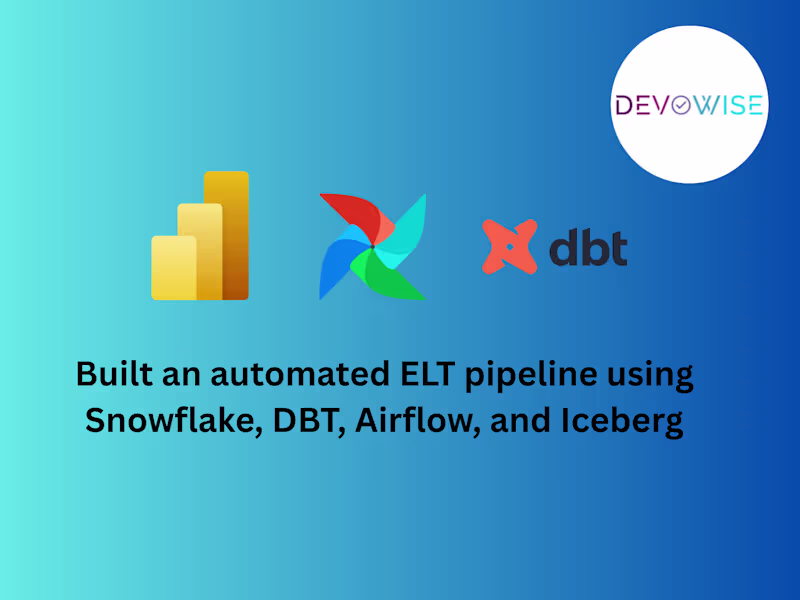
Analytics Engineer | Snowflake, Airflow, dbt


Web Design Studio | Framer, Webflow & AI Solutions
Web Design Studio | Framer, Webflow & AI Solutions
Backend, Cloud & DevOps


Brand Strategist and Product Design, Full-stack & AI Dev.
- $5k+
- Earned
- 1x
- Hired
- 29
- Followers
Brand Strategist and Product Design, Full-stack & AI Dev.


Professional Accountant | Bookkeeping, Financial Reporting
Webflow Dev & Martech guy 💗

Data Engineering & AI,