Investor Pitch Deck Design for THIS™

Muhammad Tahir A


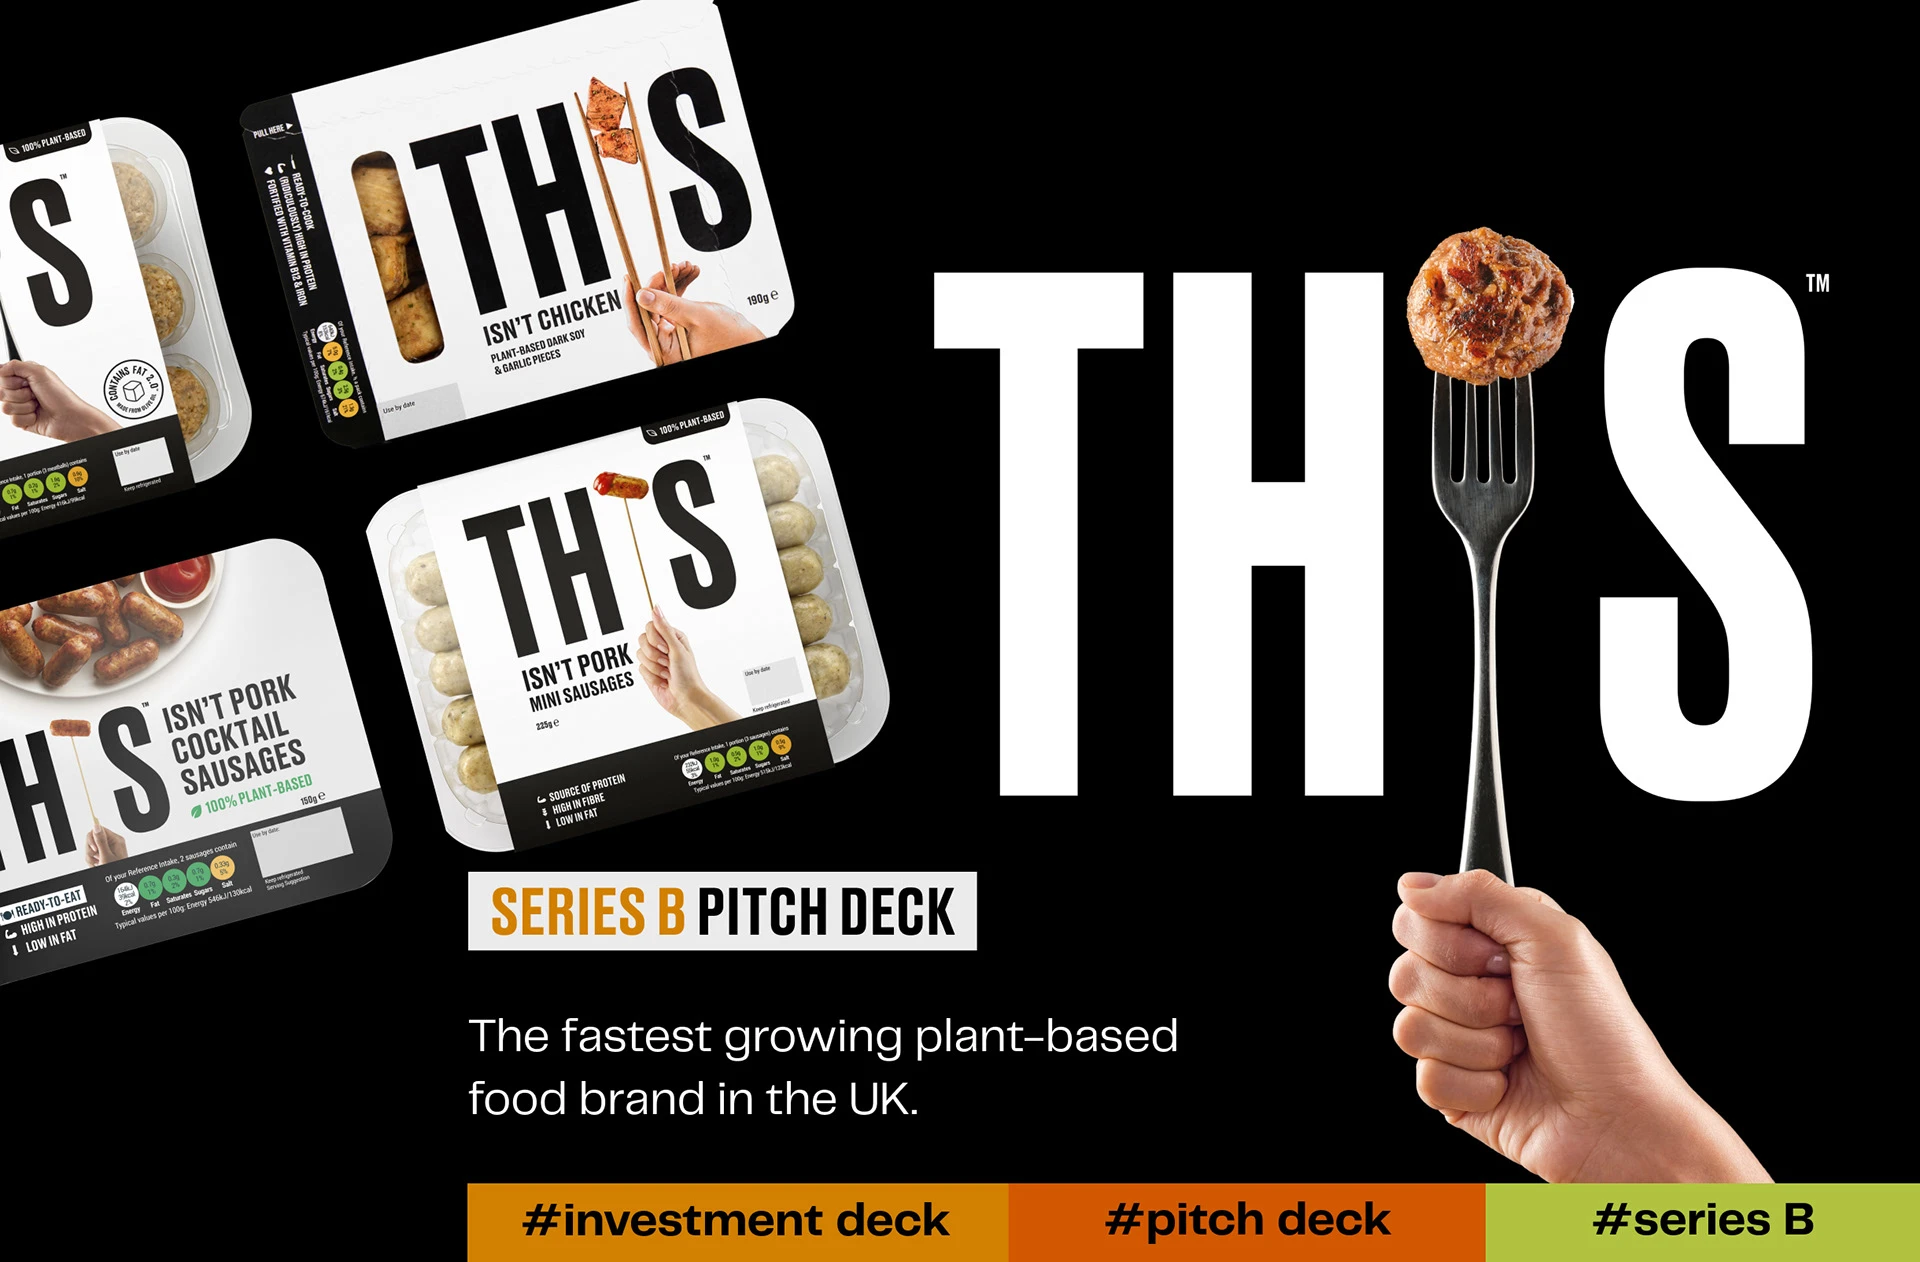
Case Study:
THIS™ Plant-Based Food Brand , UK
Series B Investor Pitch Deck
About the Brand:
THIS™ is a UK-based, hyper-popular plant-based food brand known for creating hyper-realistic, high-protein meat alternatives (like THIS Isn't Chicken and THIS Isn't Bacon).
Project Overview:
As the company prepared for its Series B fundraising, it needed an investor presentation that could communicate impressive business growth while staying true to its unmistakable brand identity.
The challenge wasn't simply designing another investment deck—it was transforming financial storytelling into an engaging visual experience that investors would remember.
The Challenge
Traditional investor presentations often rely on dense charts, corporate layouts, and text-heavy slides. While informative, they rarely reflect the personality that makes consumer brands successful.
For THIS™, the presentation needed to:
Preserve the brand's playful and humorous tone
Present complex business metrics with clarity
Showcase rapid commercial growth
Communicate market opportunity confidently
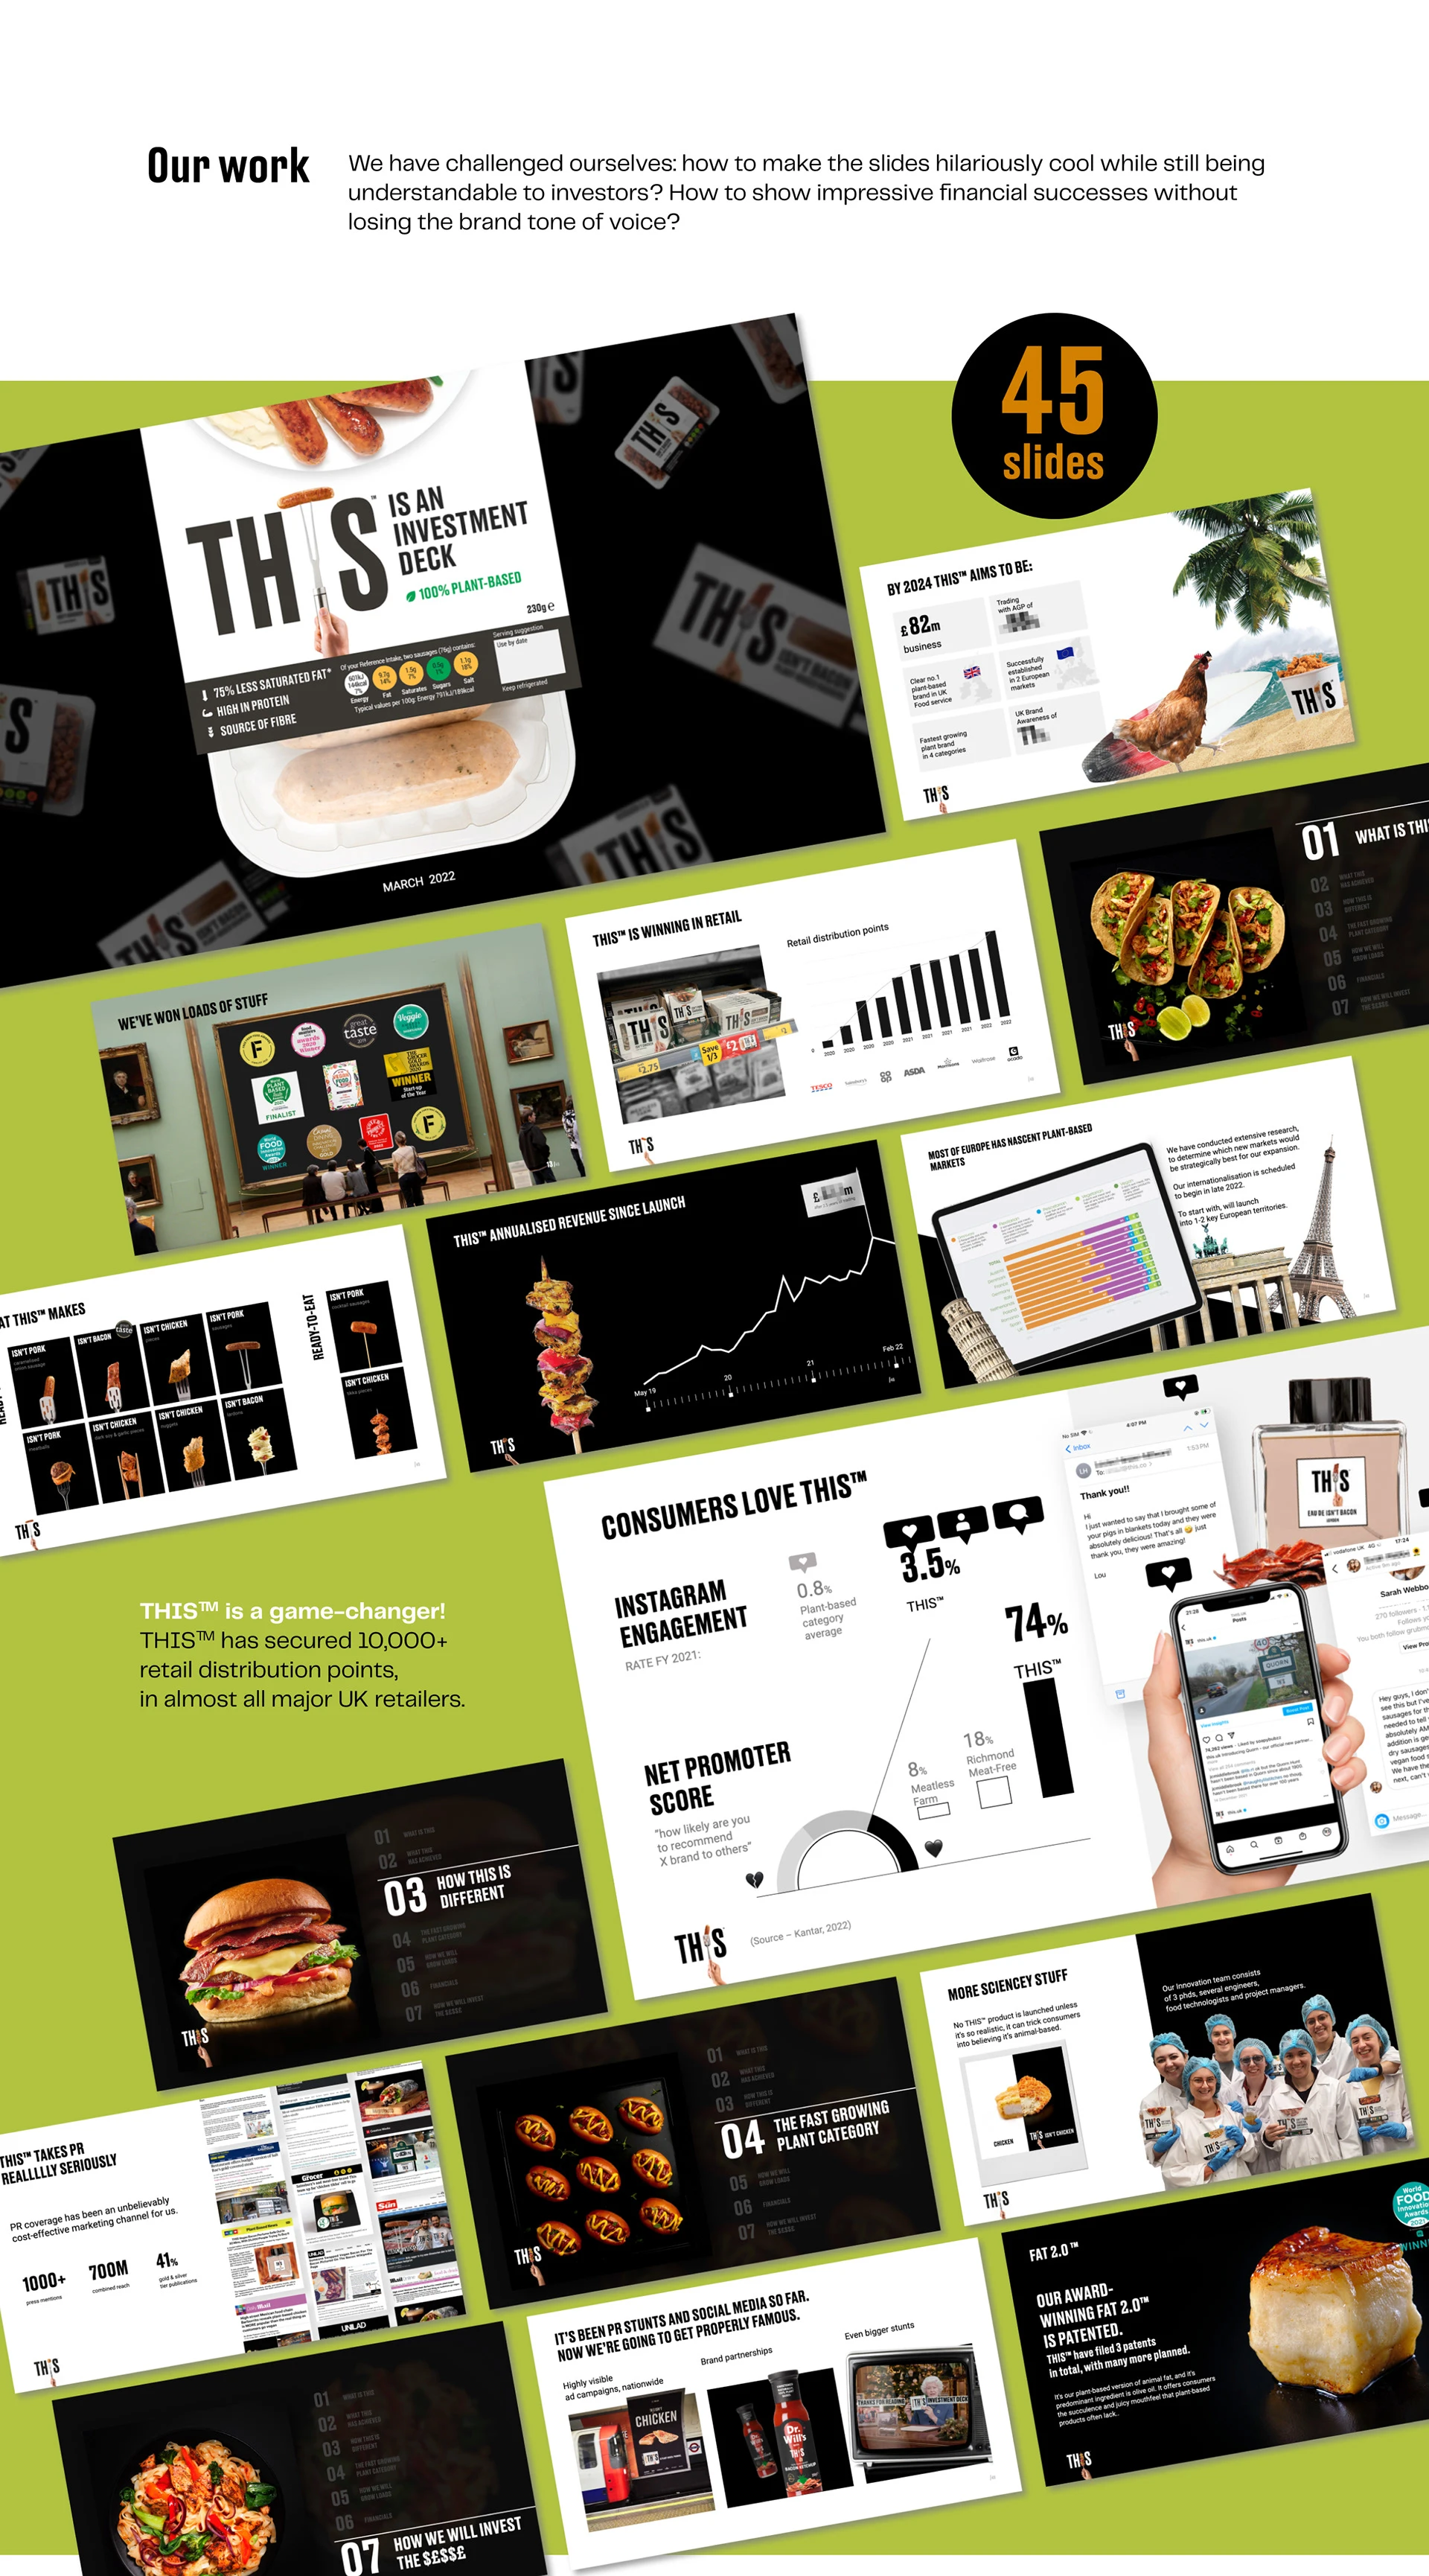
Keep investors engaged across a 45-slide presentation
Balance entertainment with credibility
The biggest design question became:
How do you make investors smile while convincing them to invest millions?
BEFORE
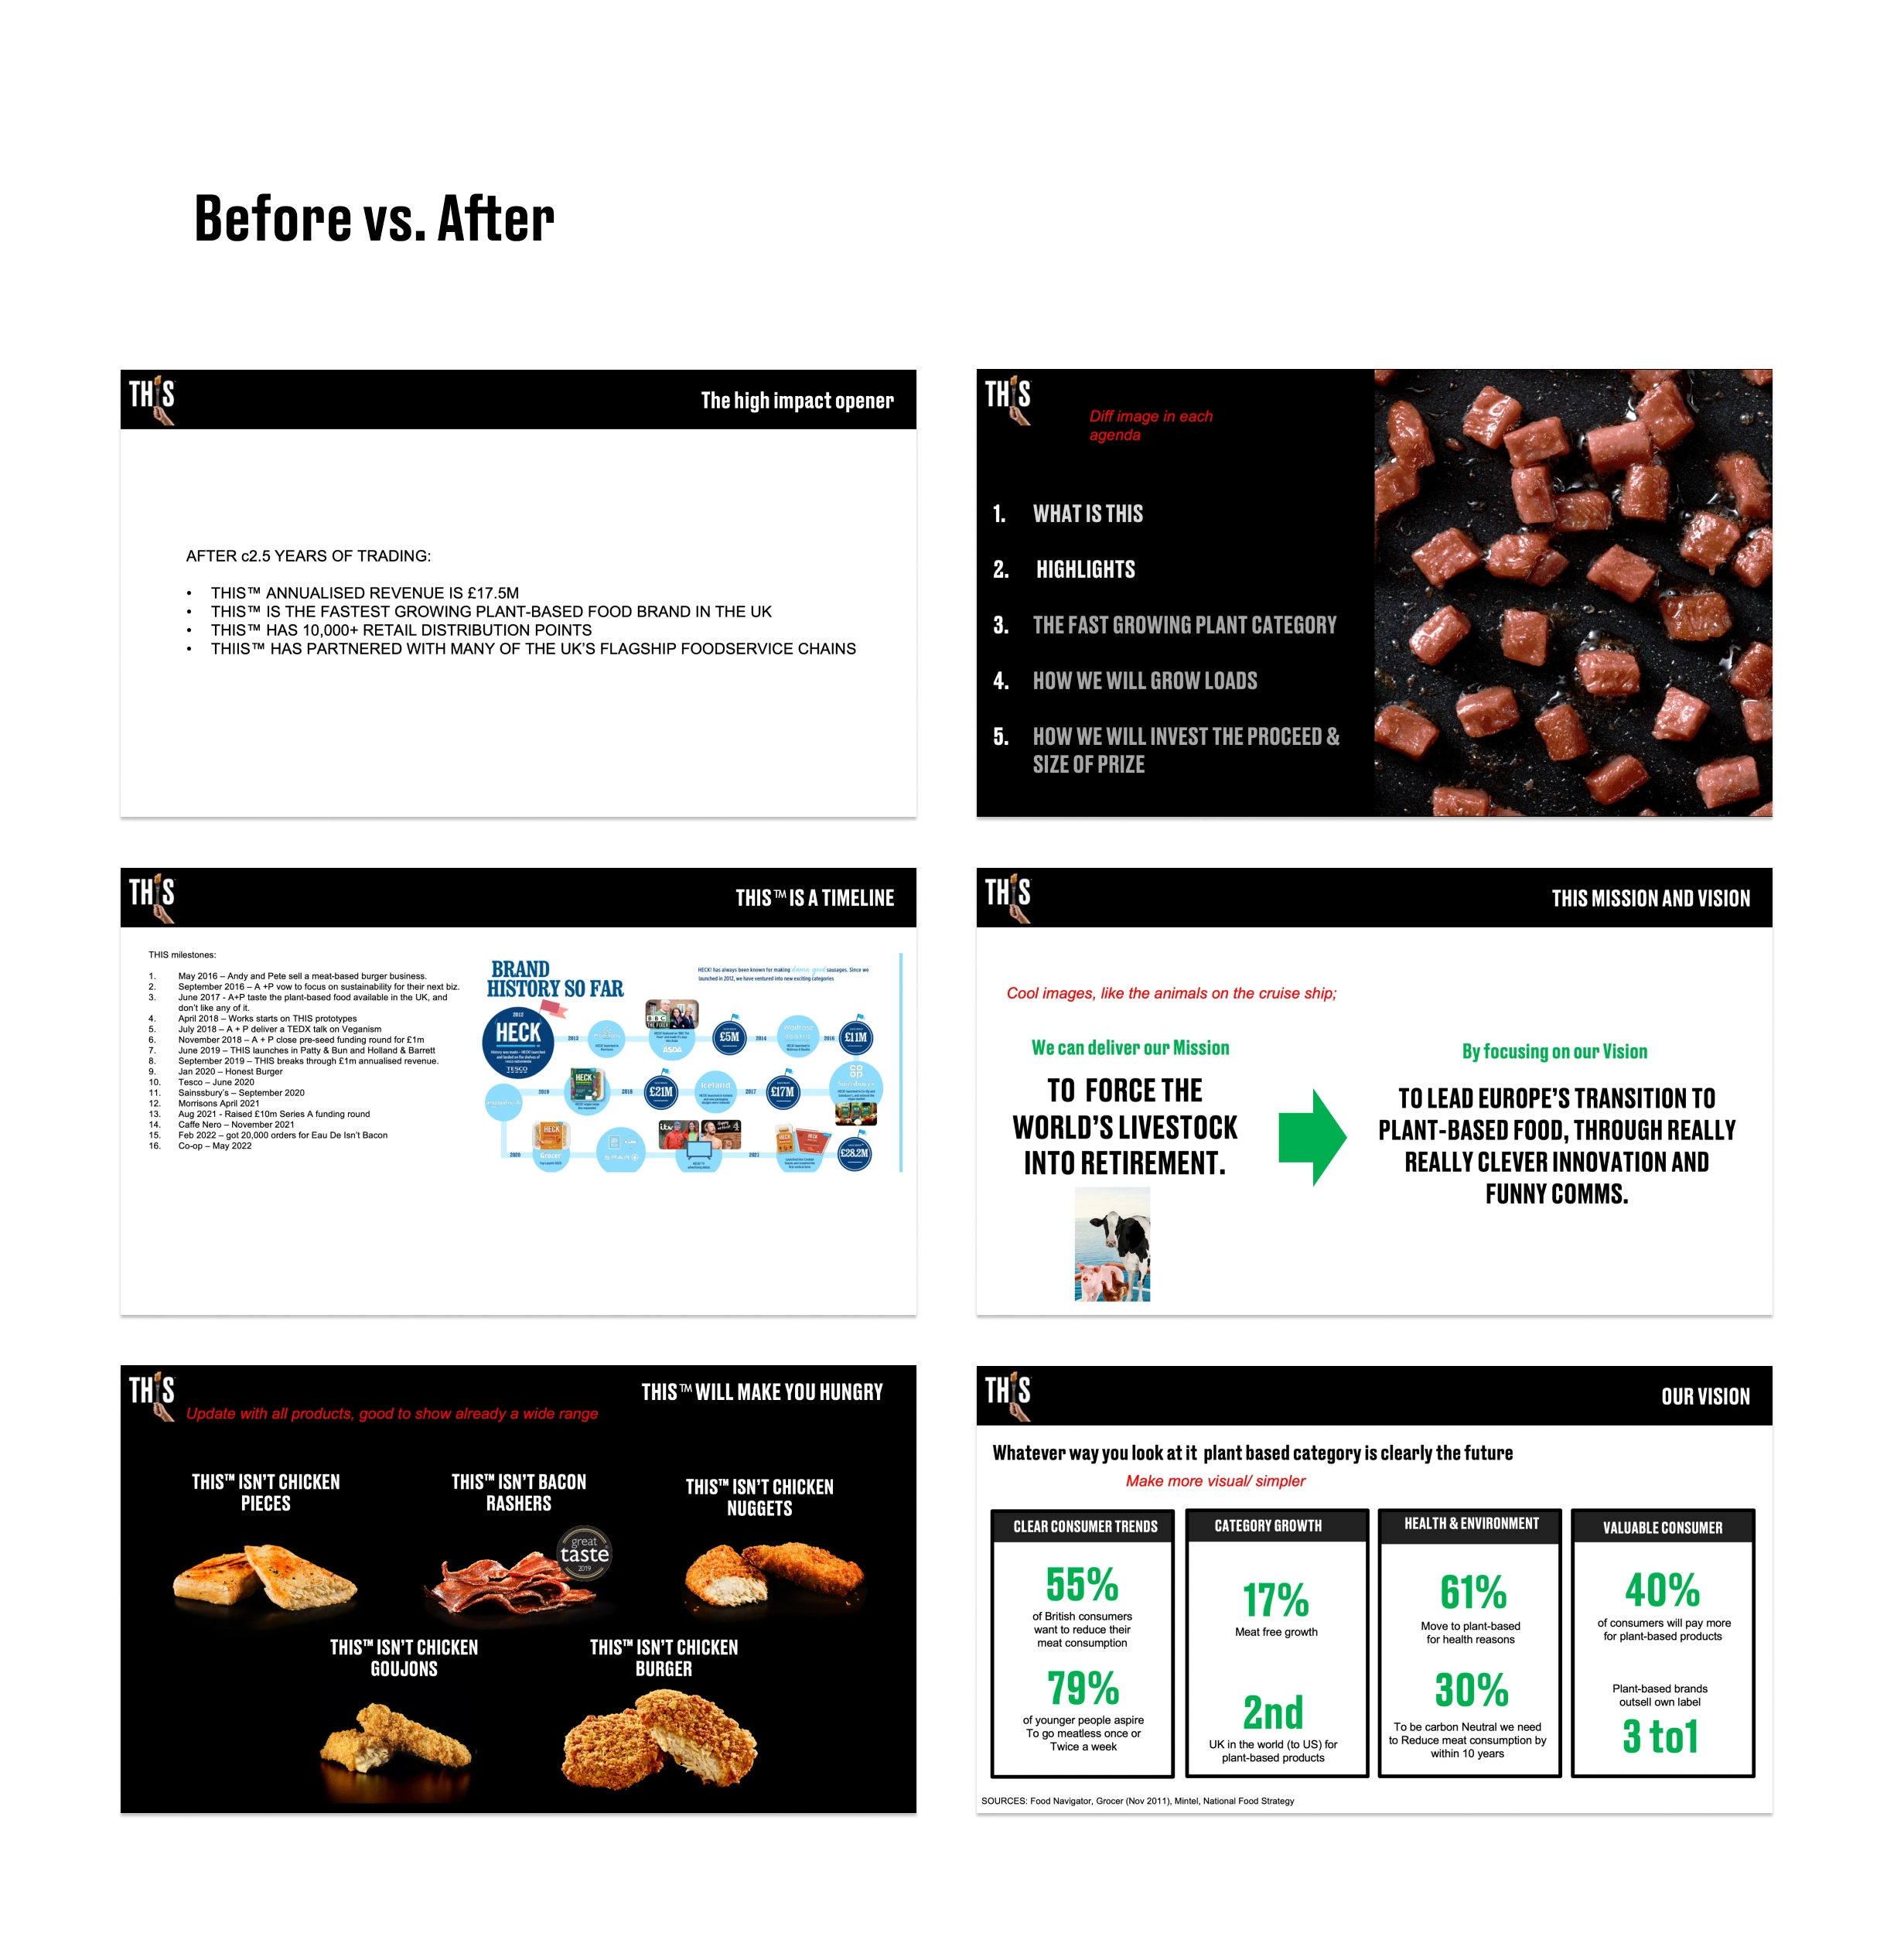
BEFORE
AFTER
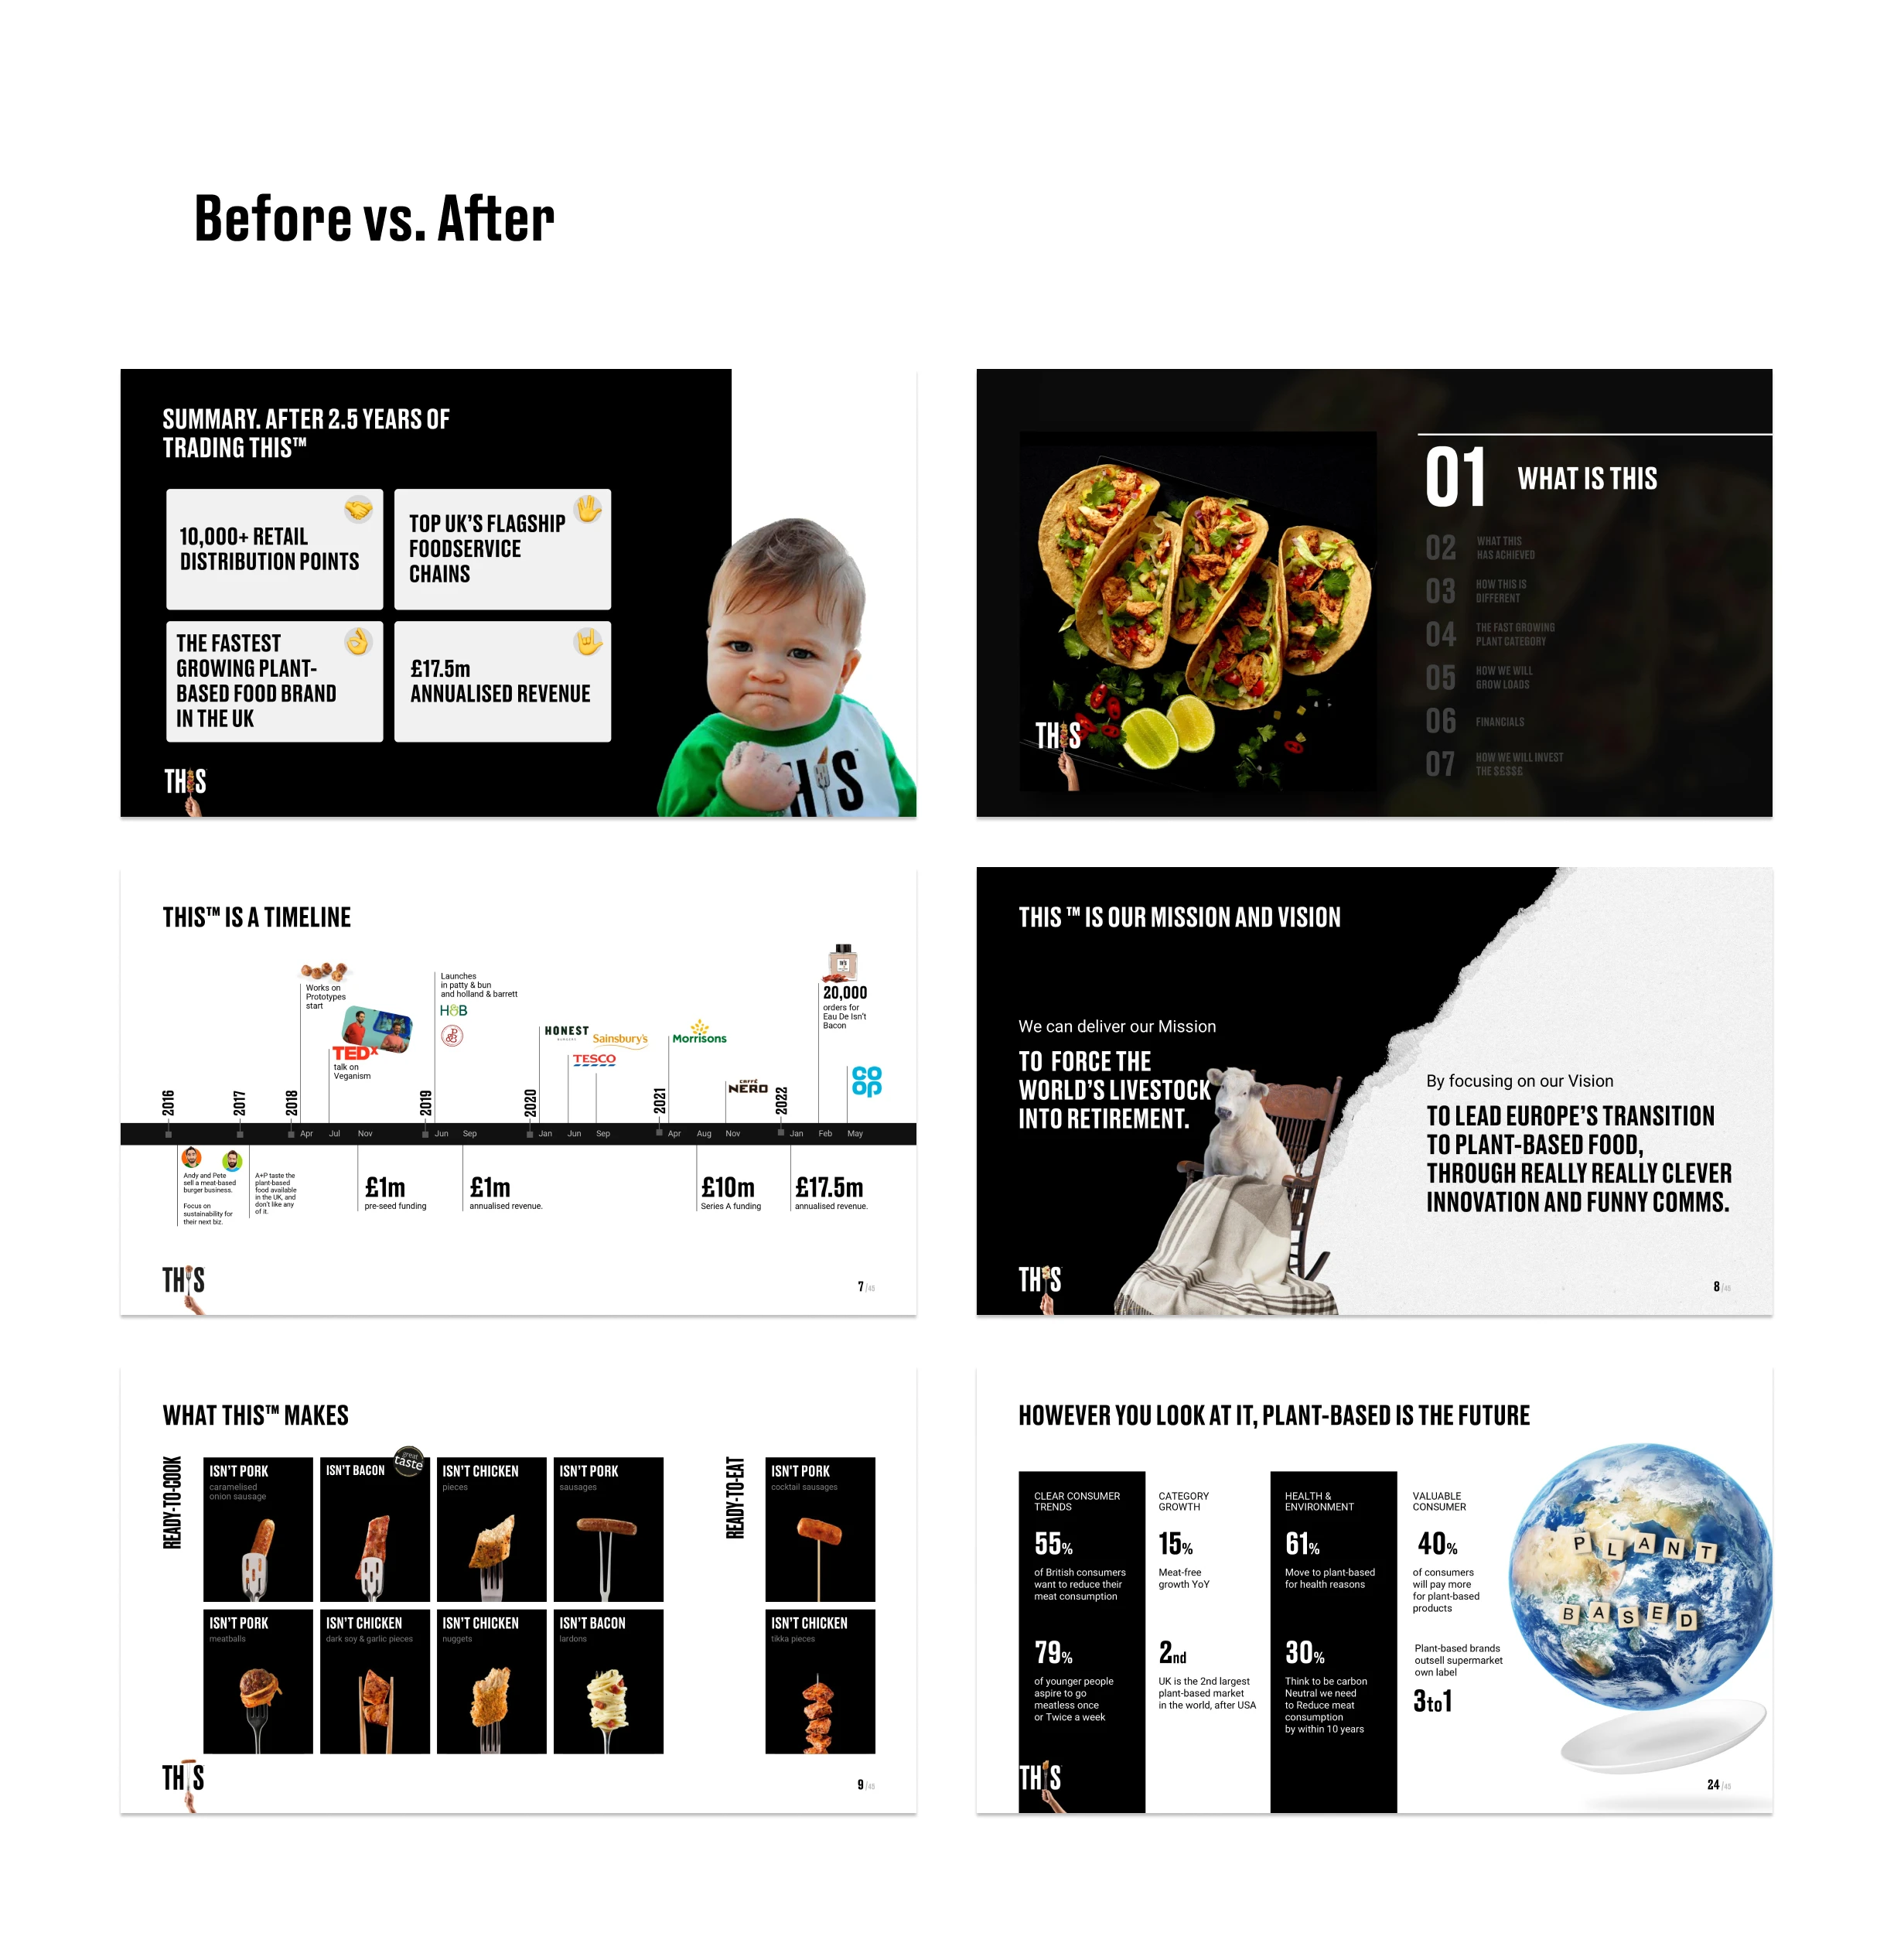
AFTER
Design Goals
The entire presentation focused on four key objectives:
Maintain strong brand consistency
Simplify investor decision-making
Increase information retention
Create memorable storytelling
Design Strategy
1. Brand-First Presentation Design
Instead of separating branding from business communication, every slide embraced the existing visual identity.
This included:
Bold typography
High-contrast layouts
Minimalistic composition
Large product imagery
Humorous visual moments
Strong visual hierarchy
The presentation immediately felt like THIS™.
2. Storytelling Before Numbers
Rather than overwhelming investors with spreadsheets, every section followed a logical business story:
Brand introduction
Market opportunity
Consumer trends
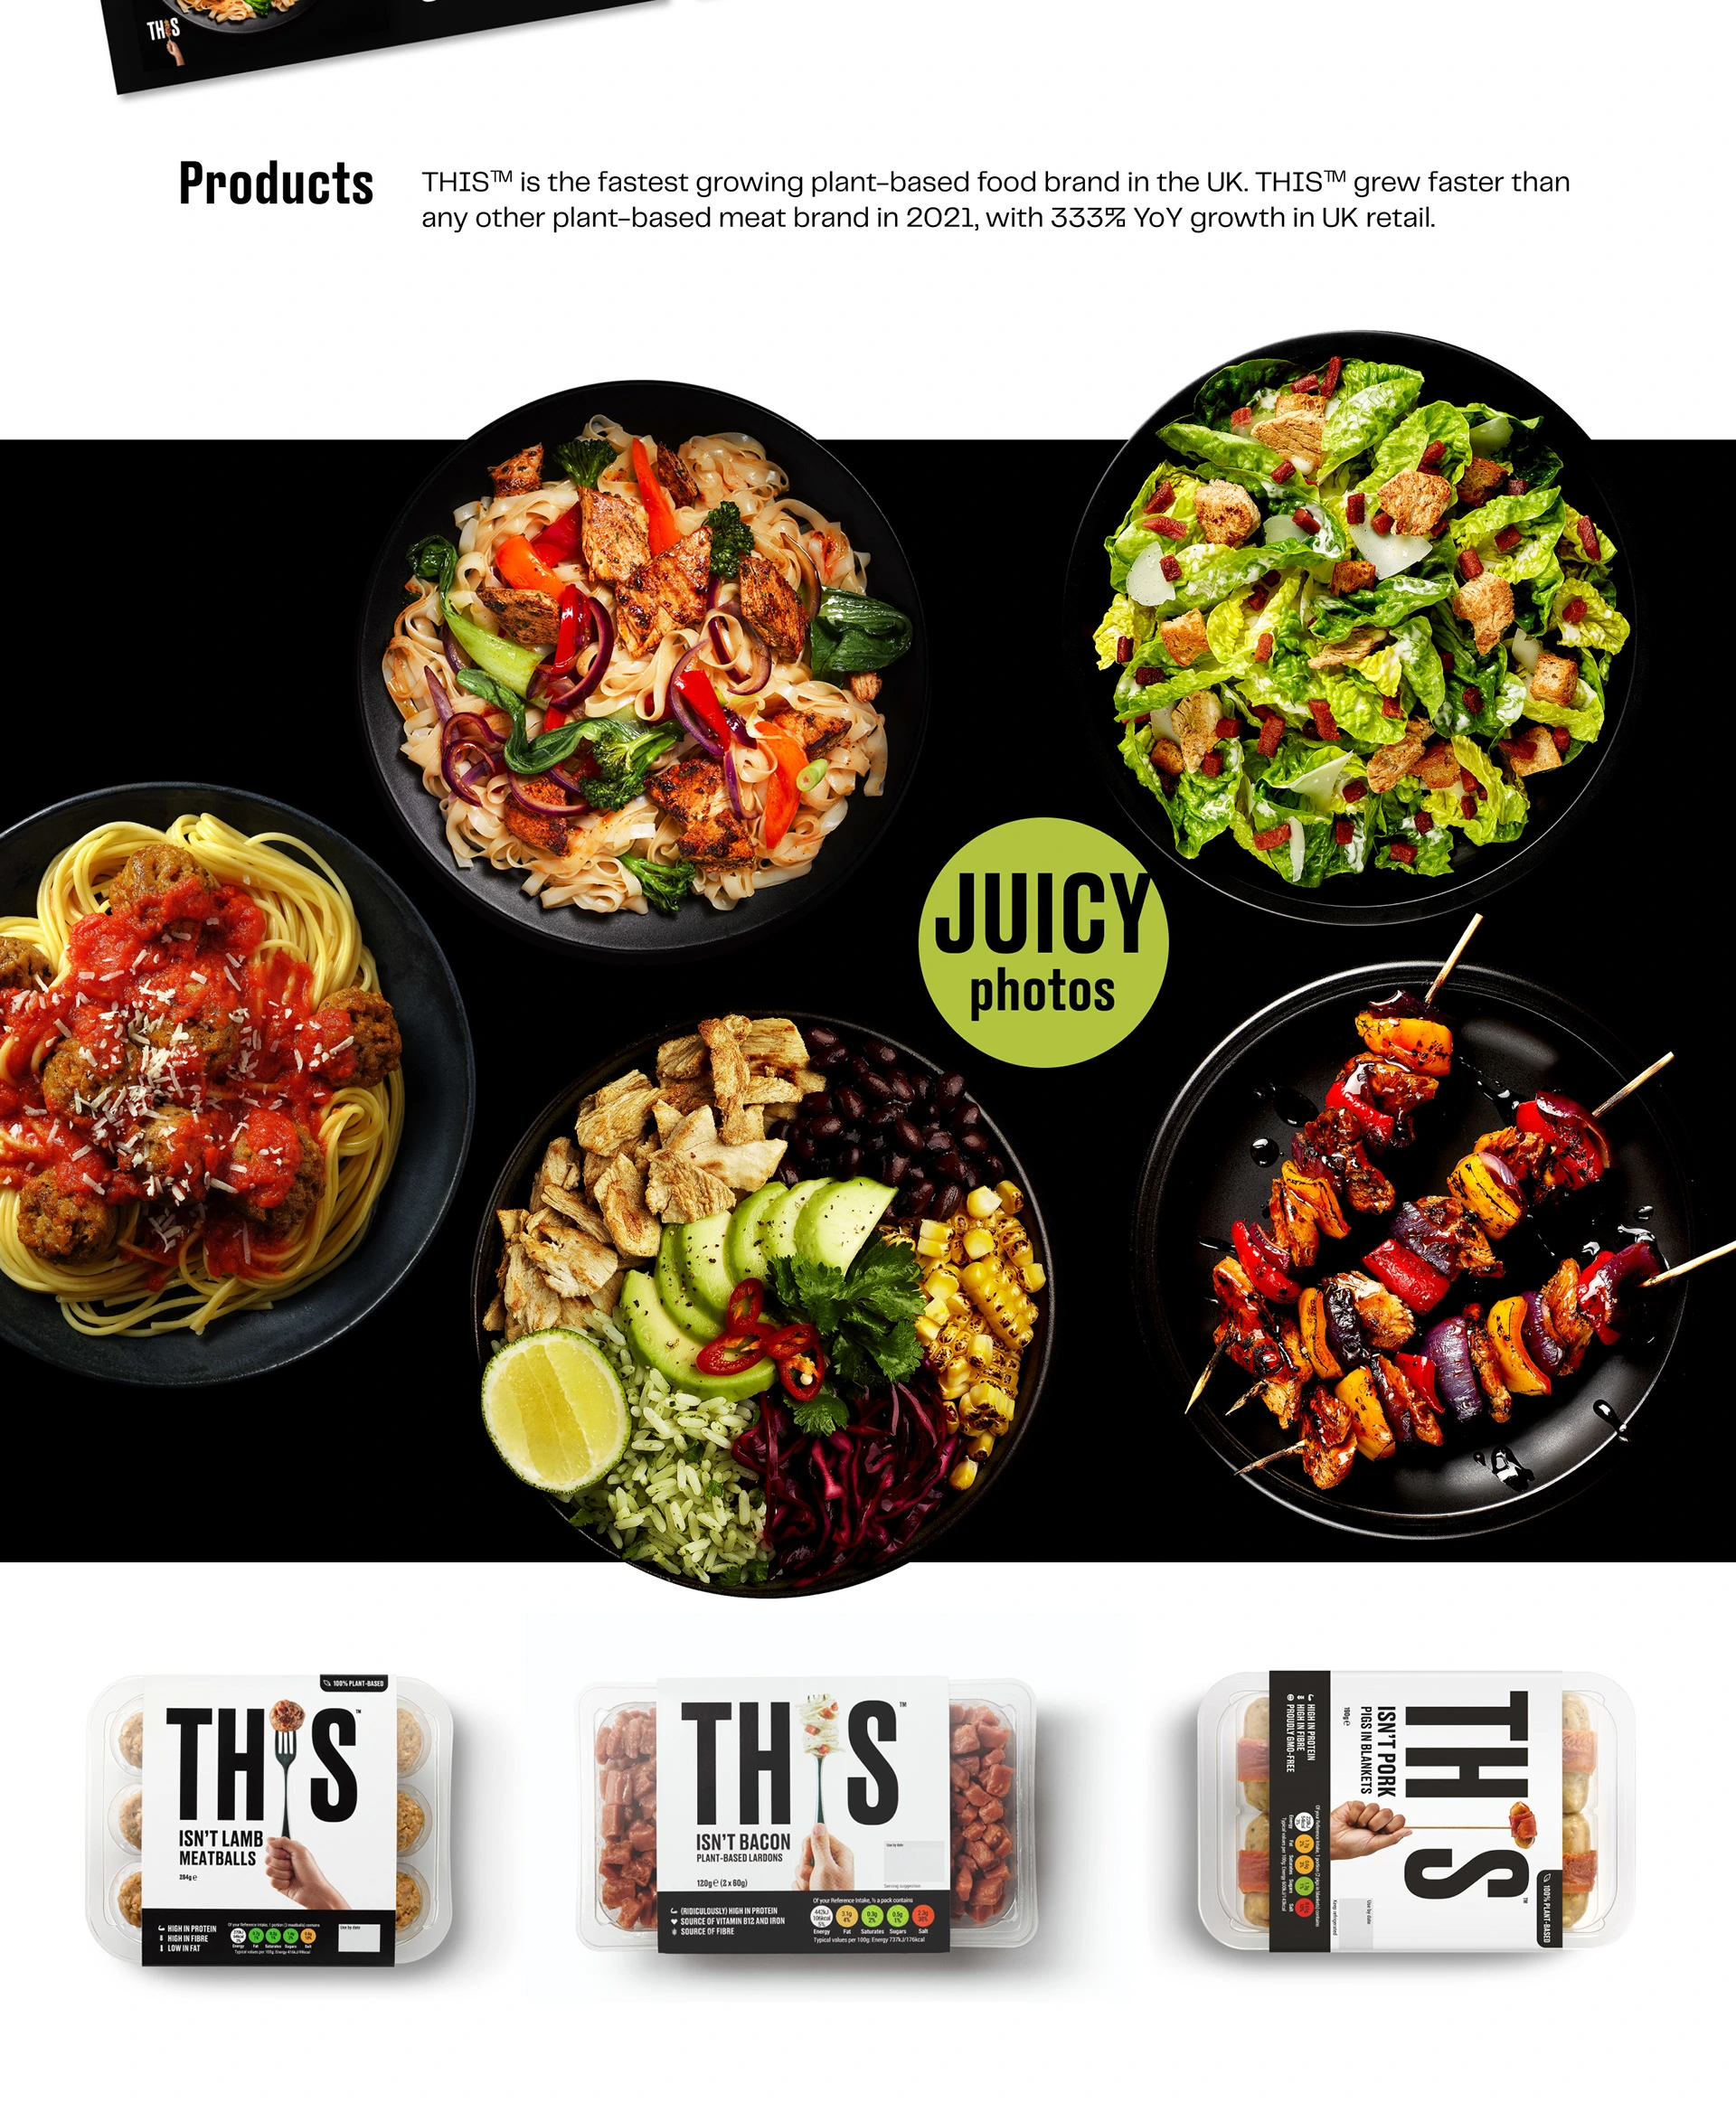
Product portfolio
Retail expansion
Financial performance
Growth strategy
Investment opportunity
This narrative structure helped investors understand why the numbers mattered.
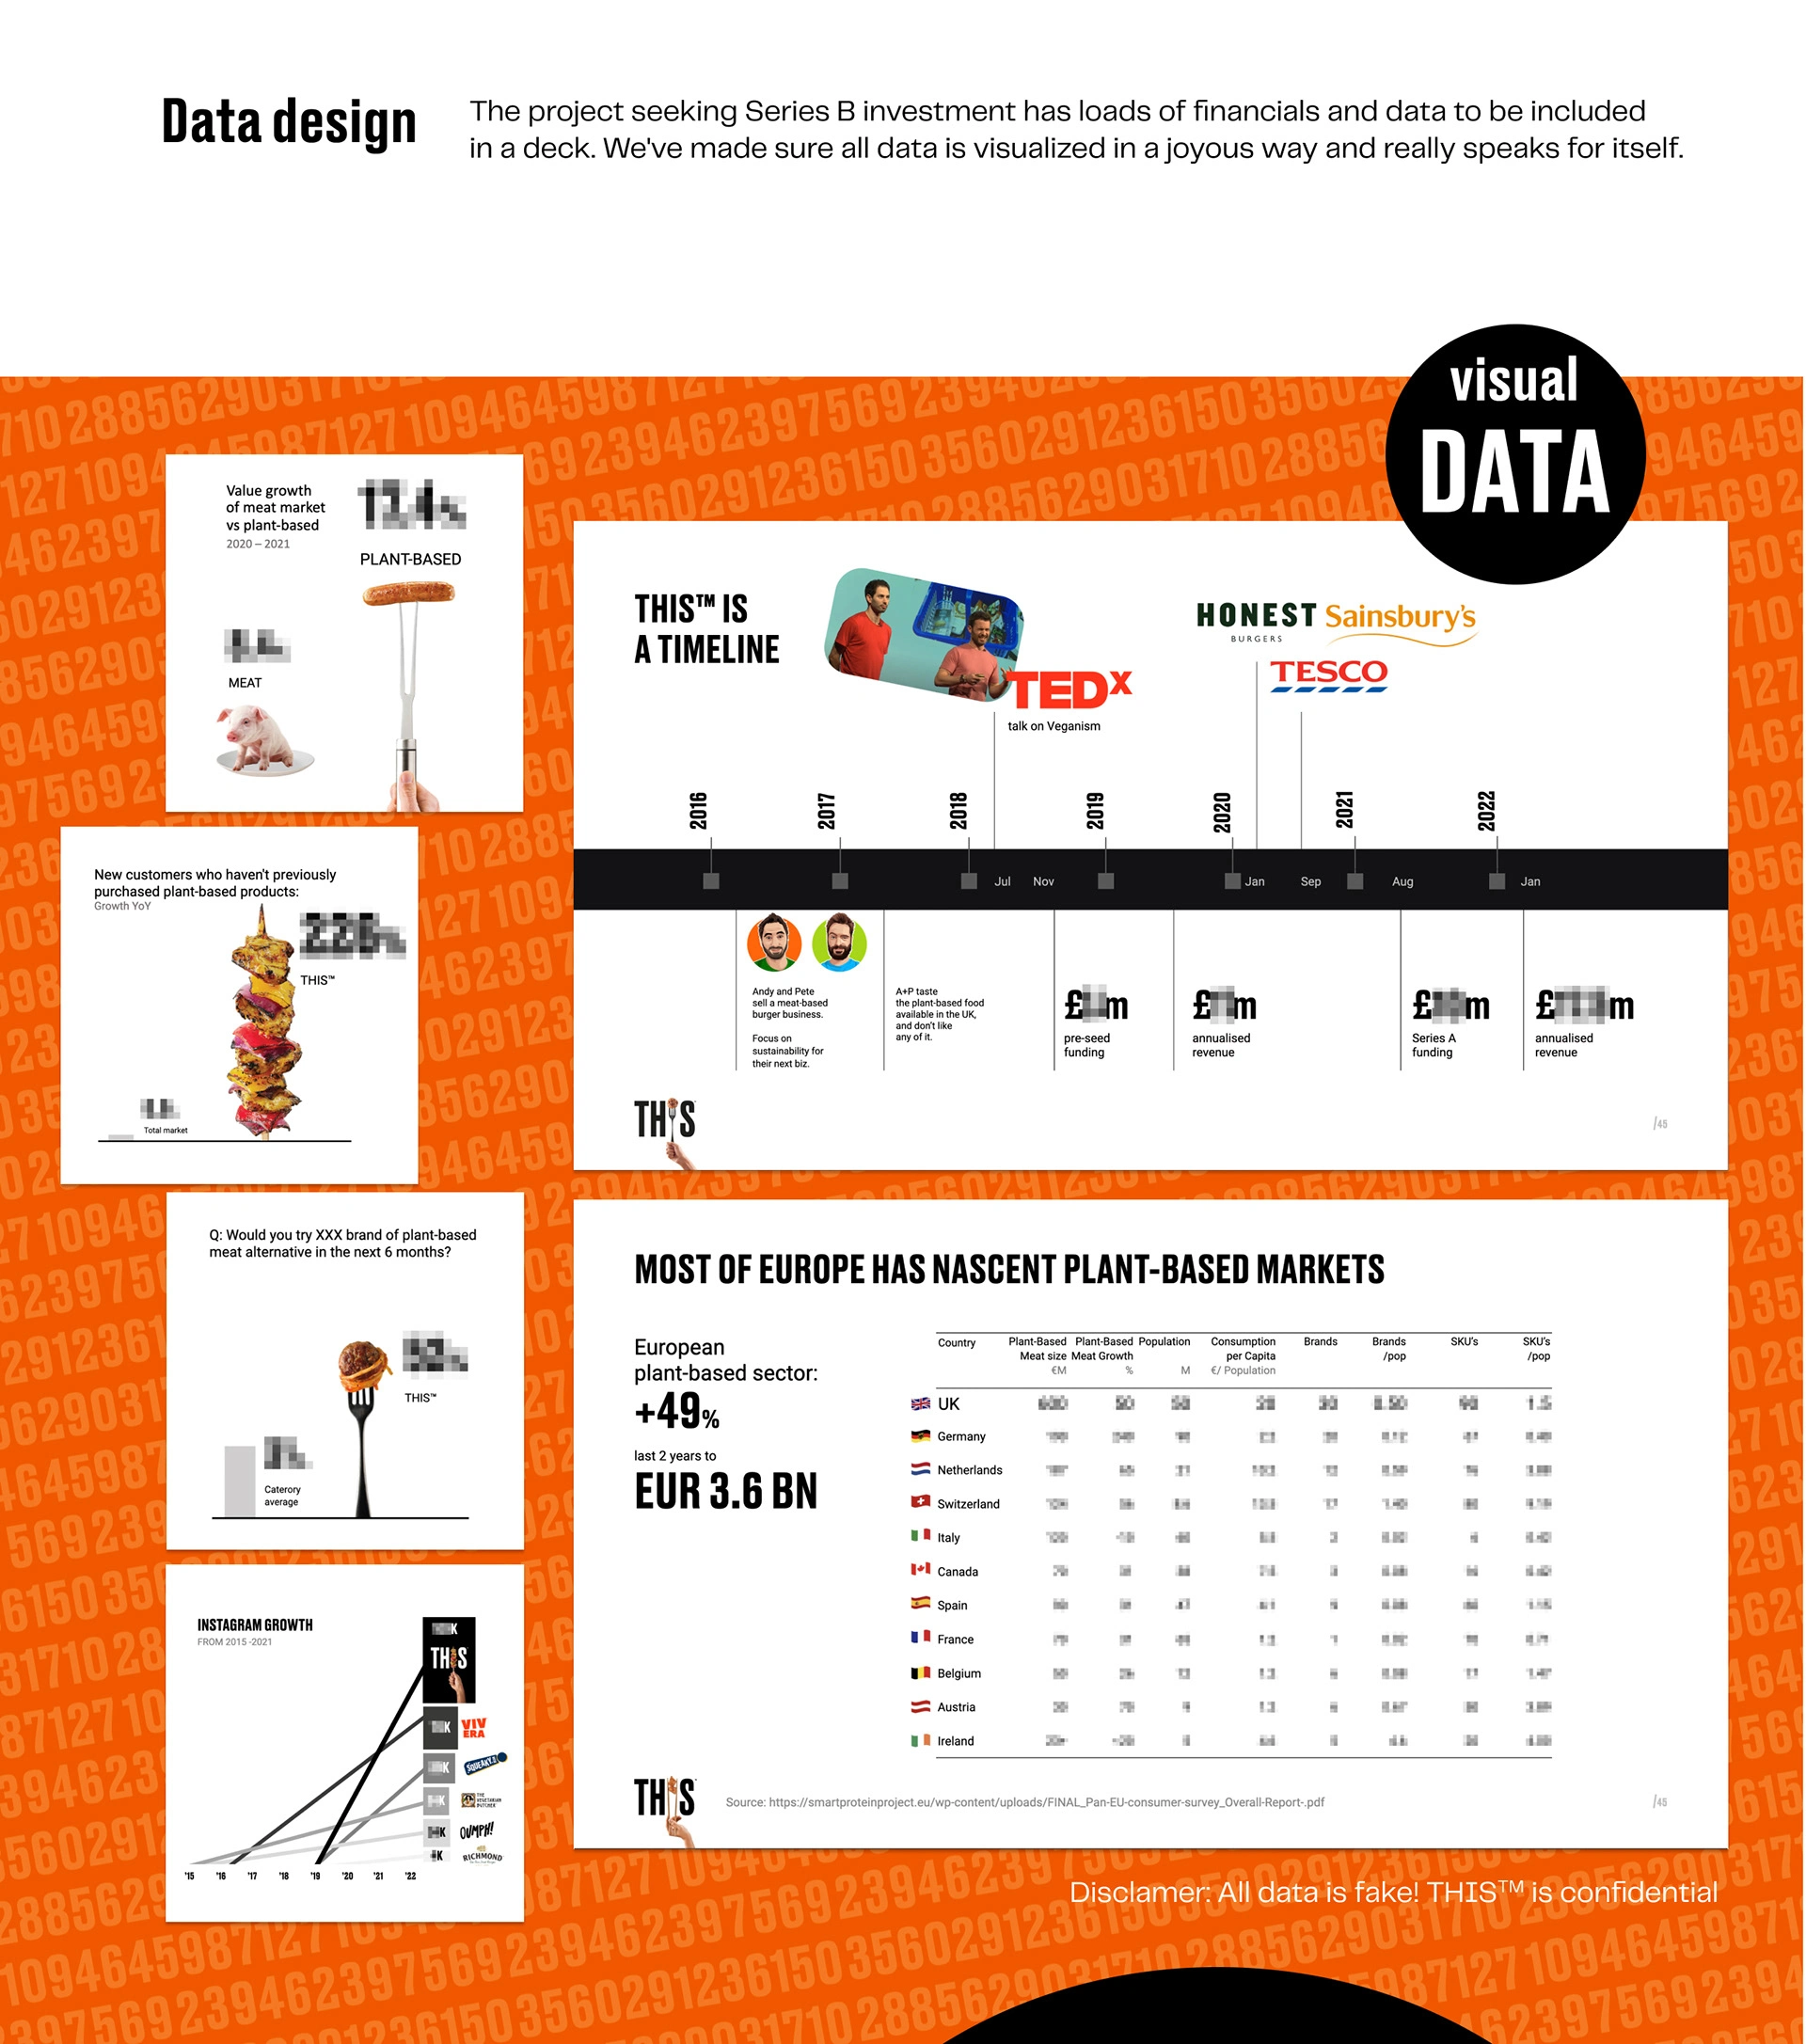
3. Simplifying Complex Information
Large amounts of business information were transformed into digestible visuals through:
Timelines
KPI cards
Comparison layouts
Infographics
Market statistics
Retail distribution visuals
Growth charts
Product ecosystems
4. Visual Engagement
Instead of repetitive corporate slides, every section introduced new visual interest using:
Creative photography
Dynamic compositions
Product-focused imagery
White space
Large typography
Editorial layouts
The result maintained attention throughout all 45 slides.
Design Process
Research
Brand identity analysis
Existing marketing materials
Consumer communication style
Competitor investor presentations
FMCG fundraising presentations
Information Architecture
Content hierarchy
Slide sequencing
Section organization
Investor reading flow
Wireframing
Layout exploration
Content prioritization
Presentation structure
Visual Design
Typography system
Color consistency
Iconography
Charts
Data visualization
Presentation components
Final Presentation
Investor-ready deck
High-resolution graphics
Presentation optimization
Brand consistency review
Tools Used
Design
Adobe Illustrator
Adobe Photoshop
Figma
Presentation
Microsoft PowerPoint
Google Slides
Keynote
Data Visualization
Excel
PowerPoint Charts
Custom Infographics
Project Highlights
Industry: Plant-Based Food / FMCG
Project Type: Series B Investor Pitch Deck
Slides Designed: 45+
Focus Areas: Investment Storytelling, Data Visualization, Brand Communication
Audience: Investors, Venture Capital Firms, Strategic Partners
Deliverables: Investor Presentation, Business Storytelling, Executive Deck, Financial Visualization, Brand-Aligned Presentation Design
Like this project
Posted Jul 11, 2026
Developed a 45-slide investor pitch deck blending storytelling and brand identity for THIS™'s Series B fundraising.