
Data Science and Visualization Expert

Hi Contra community!
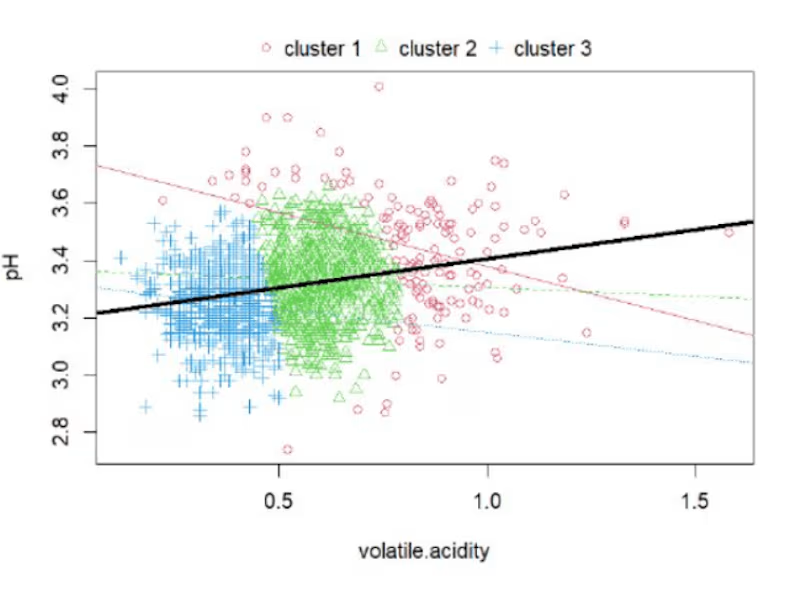
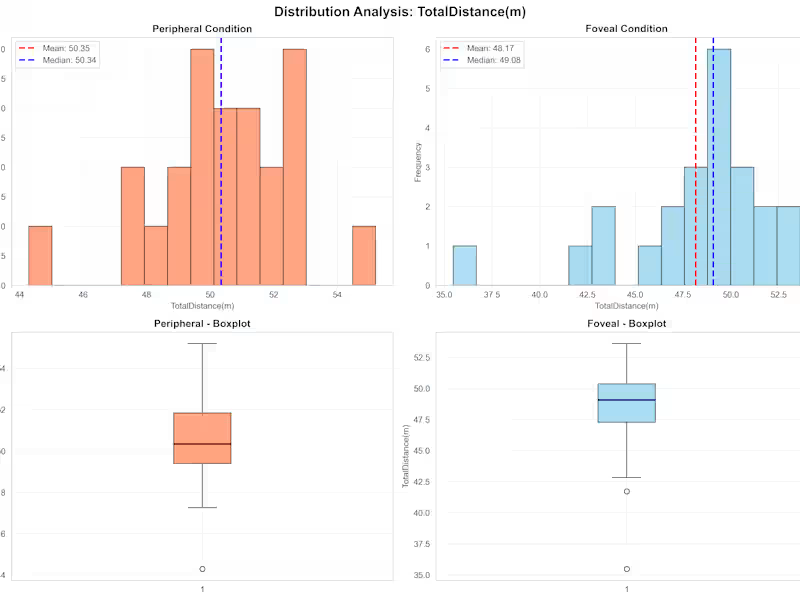
Just wrapped a rewarding project for Nauvyashree—delivered deep-dive EDA, custom visualizations, and rich survey sentiment analysis across four datasets. Each milestone included well-designed PDFs packed with clear charts and approachable explanations—making insights accessible for all audiences.
I went the extra mile with collaborative Google Meet sessions to walk the client through every analysis, helping connect the findings to big-picture goals. Feedback was fantastic, and milestone-based payments made the process smooth and transparent.
This project really strengthened my ability to turn complex results into stories that empower client decision-making. If you want visually engaging, client-focused analytics—or need easy-to-follow reports and hands-on walkthroughs for your next project—let’s connect!
1
146

Data Scientist: Python, RStudio, ML, BI, NLP, DL, LLM
Data Scientist: Python, RStudio, ML, BI, NLP, DL, LLM


Transforming complexity into clarity through data.
Transforming complexity into clarity through data.


Data Science with Machine Learning Algorithms Expertise
Data Science with Machine Learning Algorithms Expertise


Full-Stack & AI Developer building scalable SaaS products
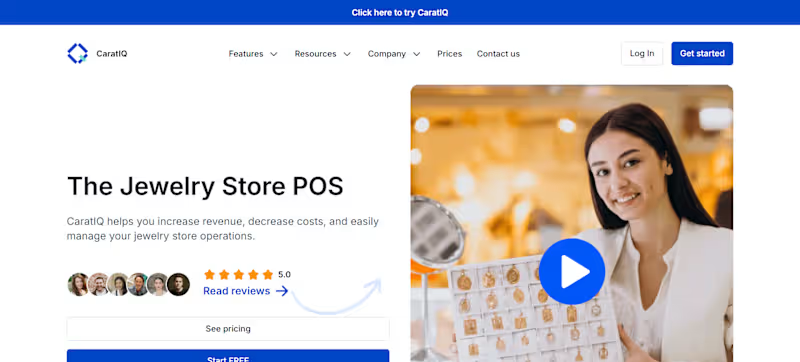
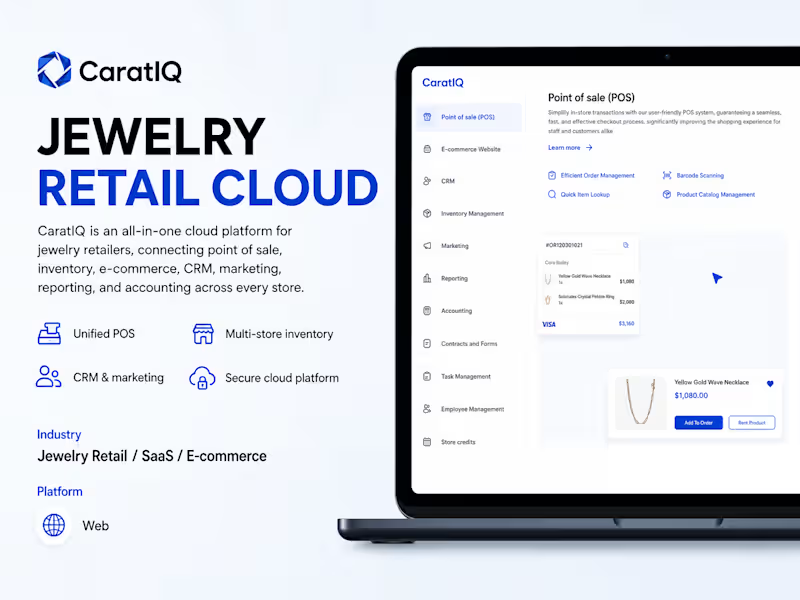
CaratIQ — Modern Jewelry Management & Catalog Platform
Managing dynamic jewelry inventories across multiple sales channels often breaks under traditional database models due to real-time pricing recalculations and complex SKU variations.
What I Built:
• Dynamic Catalog & Multi-Attribute Filtering: Architected sub-150ms catalog searches handling live metal spot pricing, carat grades, and stone certification tiers without client-side lag.
• Server-Rendered Architecture: Leveraged Next.js Server Components to offload bulk queries, significantly reducing initial client bundle size.
• Automated Inventory & Invoicing Sync: Integrated custom webhooks and payment flows for instant stock reservation and order processing.
• Role-Based Access Control: Built multi-tenant admin dashboards for floor staff, store managers, and suppliers.
Tech Stack:
Next.js, React, Node.js, PostgreSQL, Tailwind CSS, REST APIs & Webhooks
Results:
• Sub-150ms Query Speeds: Cut search and filtering latency by over 40% across extensive catalog datasets.
• Zero Sync Collisions: Automated live price updates and inventory locks, eliminating overselling across peak sales windows.
The Outcome:
Transformed a traditionally fragmented retail inventory system into a unified, high-speed SaaS platform that bridges in-store sales and digital catalog operations.
1
72

Data visualization engineer, Data Analyst, BI Expert
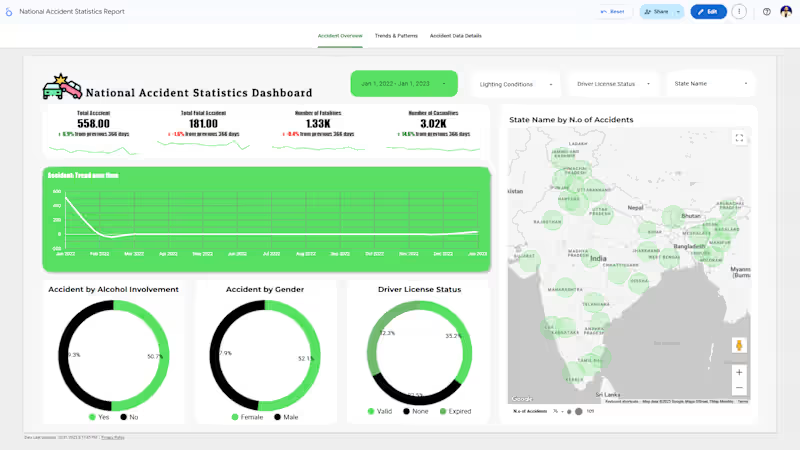
National Accident Statistics Dashboard in Google Looker Studio:
I built an interactive Looker Studio dashboard using Google Sheets as the data source to visualize national accident statistics. The report analyzes accidents by region, time, severity, and demographics. A scheduled data re:fresh every 15 minutes keeps the dashboard updated in real time. As a Data Visualization Expert, I combined automation and design to deliver a clean, insightful, and dynamic Looker Studio dashboard for data-driven decision-making.
🎉 💯 🎉
2
200

Driving Innovation with AI, Data & Strategy ✨
Driving Innovation with AI, Data & Strategy ✨



View more →

Power BI & ML Expert | Dashboards & Predictions
Power BI & ML Expert | Dashboards & Predictions



View more →