
Branding and web design across culture and tech.


Branding and web design across culture and tech.
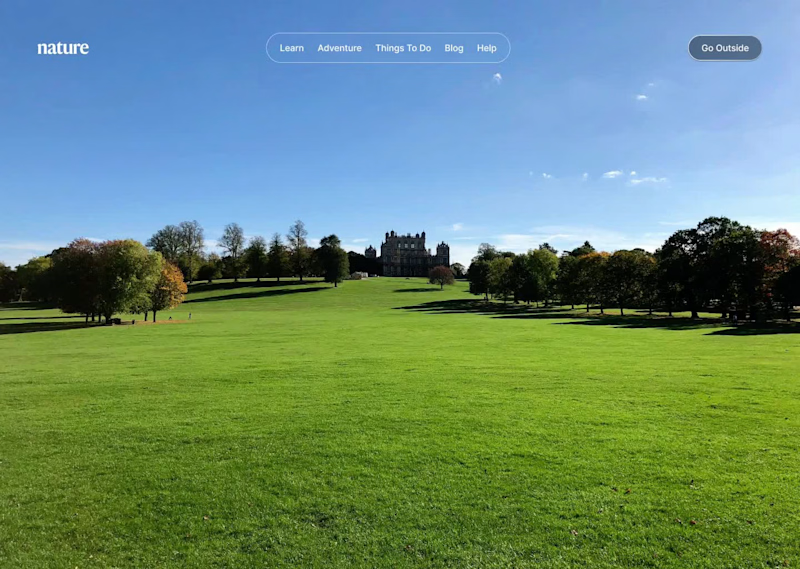
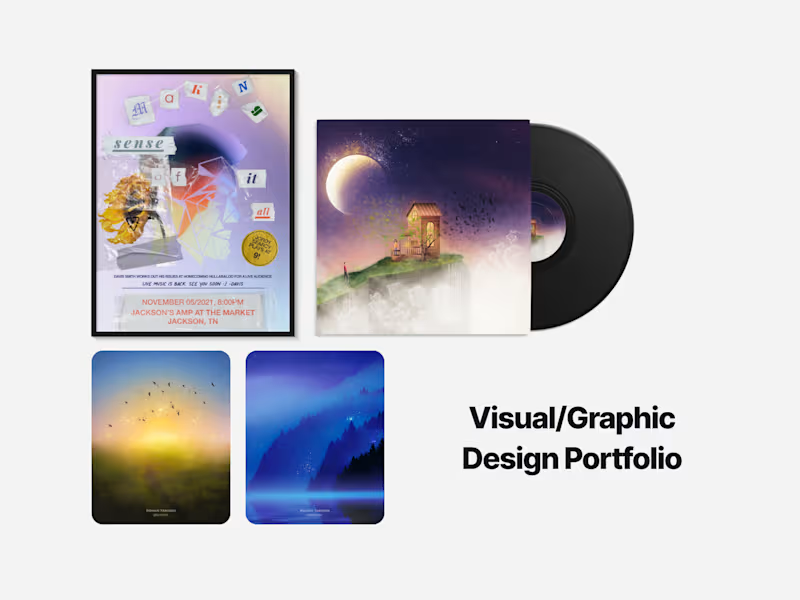
Whenever I get time, I like to do mockups to keep my creativity sharp. In this case, nature backgrounds were my inspiration to showcase all four seasons.
Long before Apple began using them, Windows offered a range of wallpapers that brought beautiful scenes from around the world to their user's desktop.
Here's some I felt best captured the essence of each season.
10
15
1.3K


UI/UX Web Designer & Web Developer | Graphic Designer
- $10k+
- Earned
- 14x
- Hired
- 5.0
- Rating
- 294
- Followers
UI/UX Web Designer & Web Developer | Graphic Designer


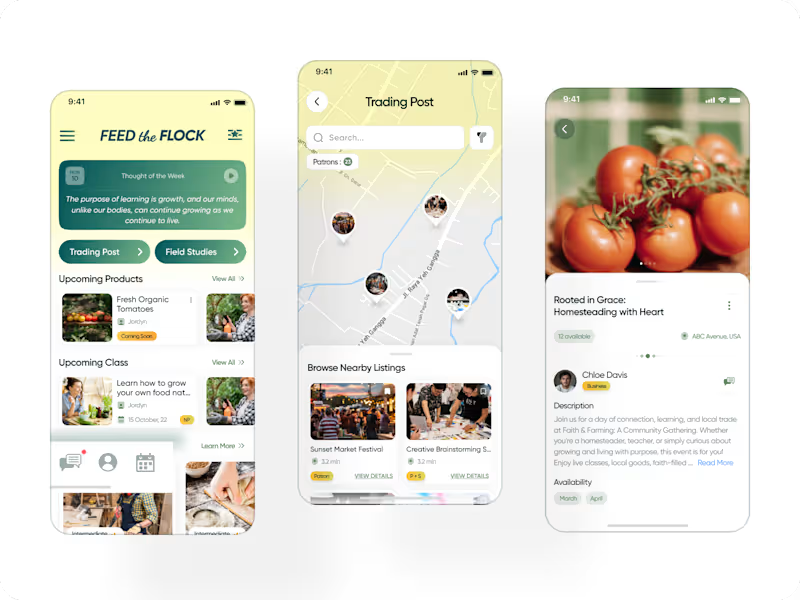
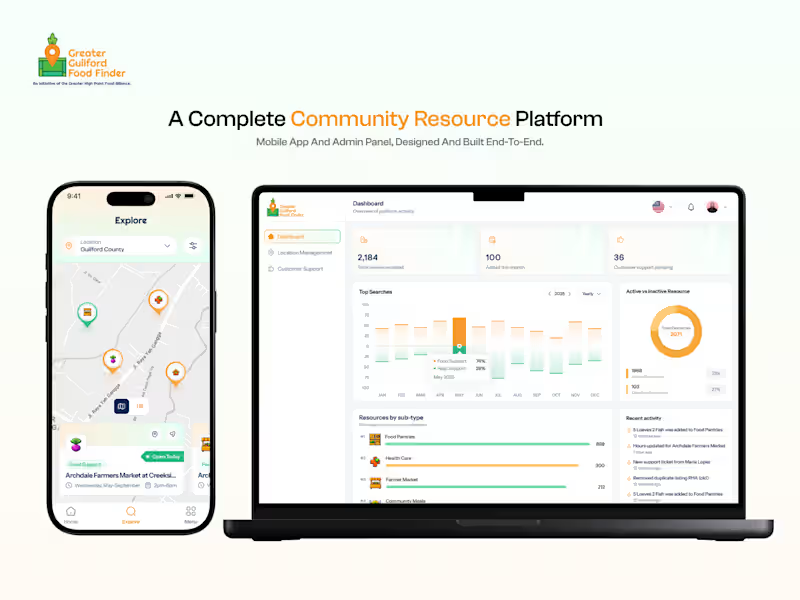
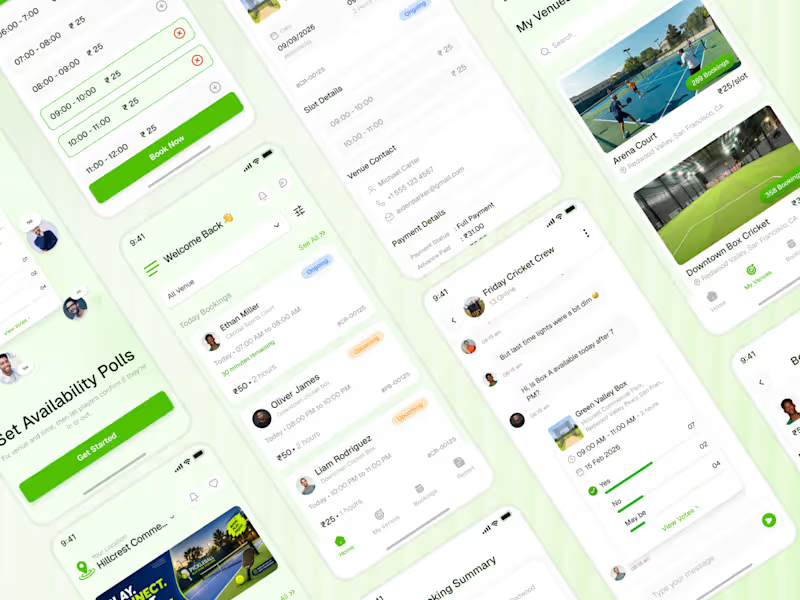

Web & Product Designer | Framer, Webflow & Shopify Expert
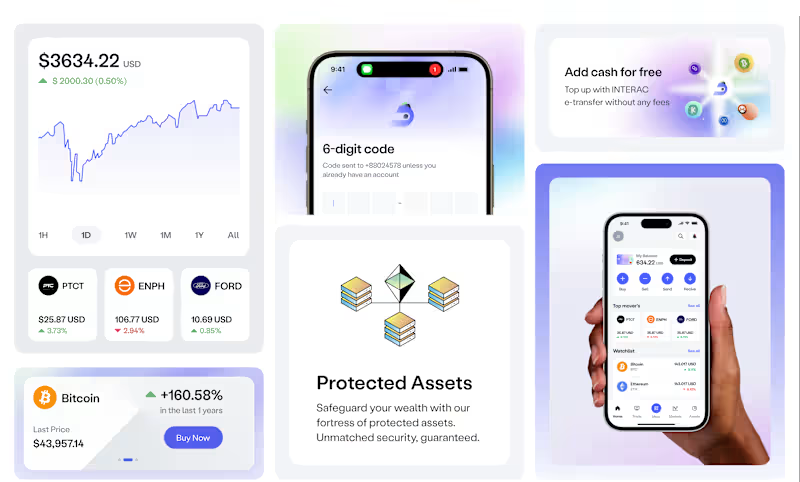
UI/UX Designer | AI Fintech SaaS Product Design in Figma for a startup
DiWallet aims to provide a decentralized, secure, and user-friendly payment environment. It will combine blockchain technology, smart contracts, AI-powered insights, decentralized identity verification, and cross-platform interoperability. The goal is to revolutionize how people transact in the digital space, creating a more efficient and transparent financial experience.
1
4
177
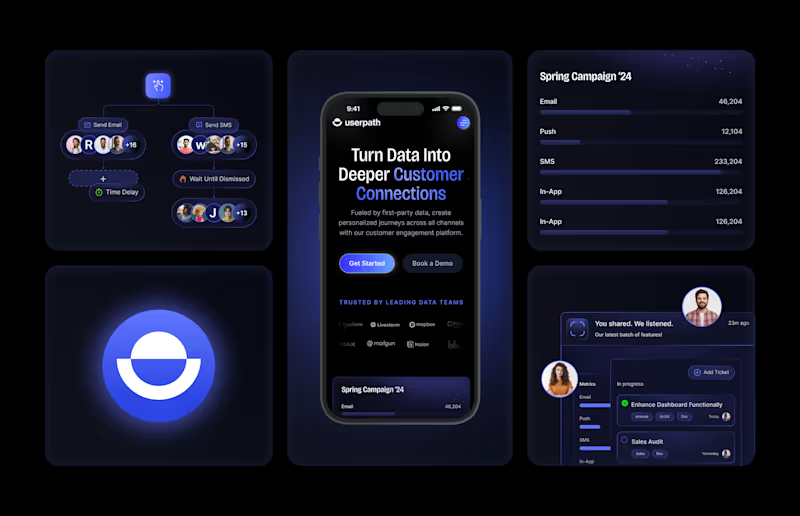
Userpath | UX/UI Design
Userpath harnesses data insights to help you build stronger, more personalized customer relationships. By analyzing behaviours, preferences, and interactions, we empower you to craft deeply resonated experiences. The focus was to align consistency with a seamless journey empowering the user to achieve value through simplicity.
1
3
141

Tenure
Tenure is a financial platform designed to facilitate savings and incentivize management for both employers and employees, offering a comprehensive solution to enhance financial well-being within the workplace.
0
155

Trade Easy - AI-Powered Market Sentiment Dashboard UI/UX Design
Trade Easy is an AI-powered trading dashboard designed for fast, clear market analysis. It delivers real-time sentiment, risk levels, and asset insights across Forex, Commodities, Equities, and Crypto. With a modern dark UI, smart data visualization, and an intuitive trading calendar, Trade Easy helps traders make confident decisions through clean design, actionable signals, and seamless user experience.
2
22
343

UI/UX Designer | Product Designer | Website Design | Mobile
- $10k+
- Earned
- 1x
- Hired
- 3
- Followers
UI/UX Designer | Product Designer | Website Design | Mobile

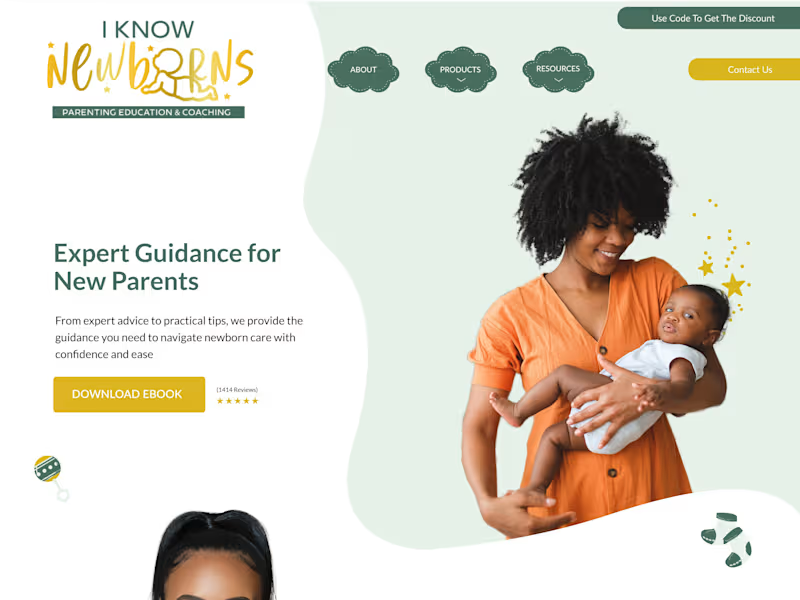
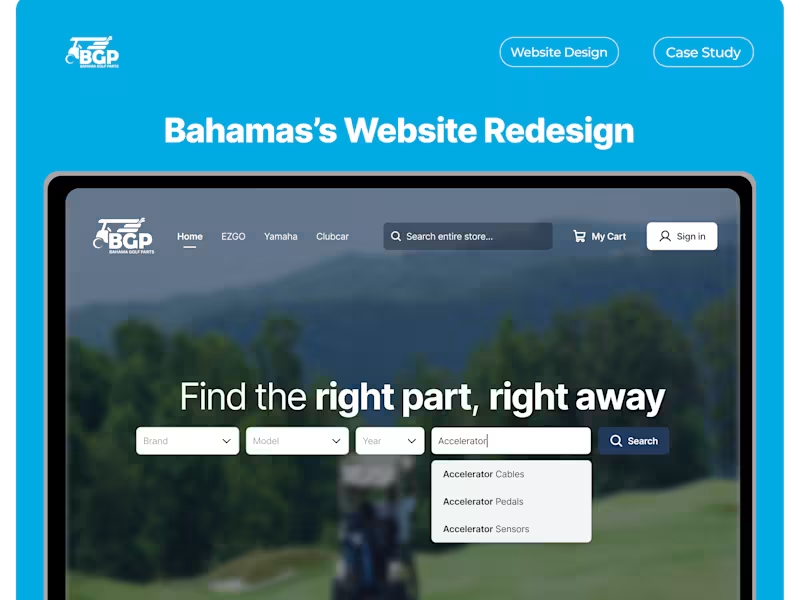


Designing logos, brands, UI/UX & websites people remember
- 5.0
- Rating
- 14
- Followers
Designing logos, brands, UI/UX & websites people remember


Product UX Designer, Illustrator, Branding Specialist.

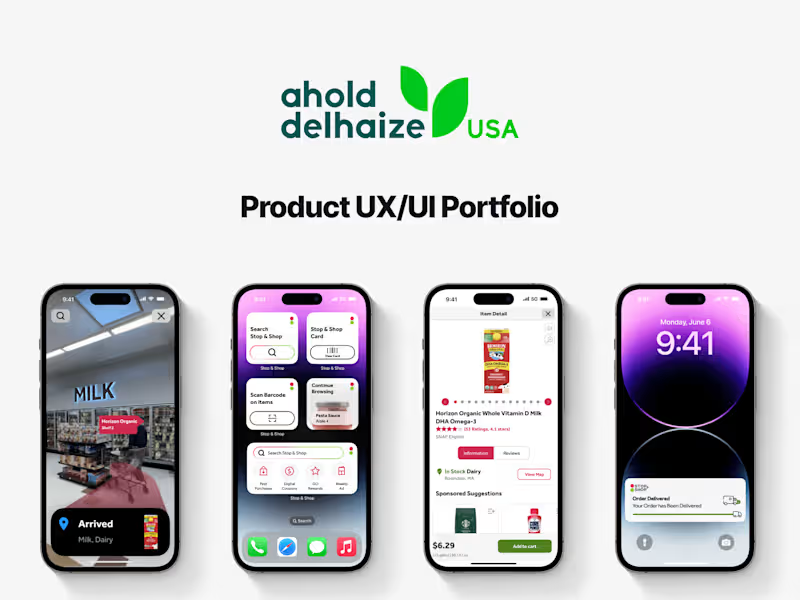


AI Interface designer and developer.

This project explores what operational intelligence looks like when infrastructure spans the planet, and beyond it.
The motion you see isn’t decorative. It represents live relationships between satellites, ground stations, data centers, and anomaly signals. Every trajectory, every fluctuation, every pulse of light reflects system behavior translated into something readable, actionable, and calm.
Instead of overwhelming operators with fragmented alerts and dense telemetry, the interface creates continuity. Risk becomes visible as a wave before it becomes a failure. Dependencies between locations become tangible through flowing connections. Probability isn’t buried in logs, it’s surfaced through movement, hierarchy, and spatial context.
This is where UX stops being interface design and becomes strategic infrastructure.
3
137
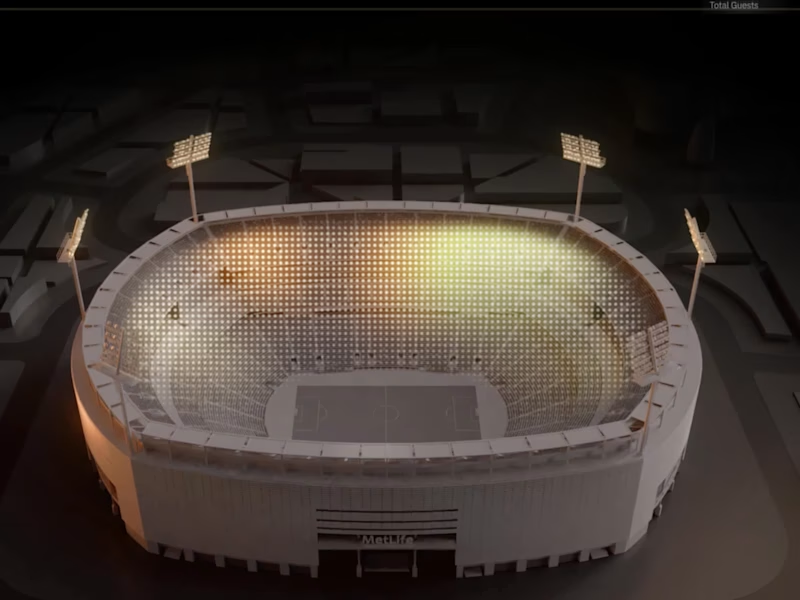
As a designer, I focused on crafting an experience that brings clarity to complexity. This project embodies the future of intelligent stadium management and sets a new standard in how we interact with data at scale.
This bird’s-eye view gives an effortless preview of how data flows across the venue, highlighting availability, network performance, and traffic patterns, helping managers ensure smooth operations for thousands of spectators.
Through motion-driven design, complex data is turned into meaningful insights. Dynamic, color-coded charts and intuitive visuals reduce cognitive load, offering clear, actionable information, like network status, crowd accessibility, and engagement - at a glance.
The real power of this animation lies in its ability to provide contextual insights at scale, enabling proactive decision-making.
2
2
216
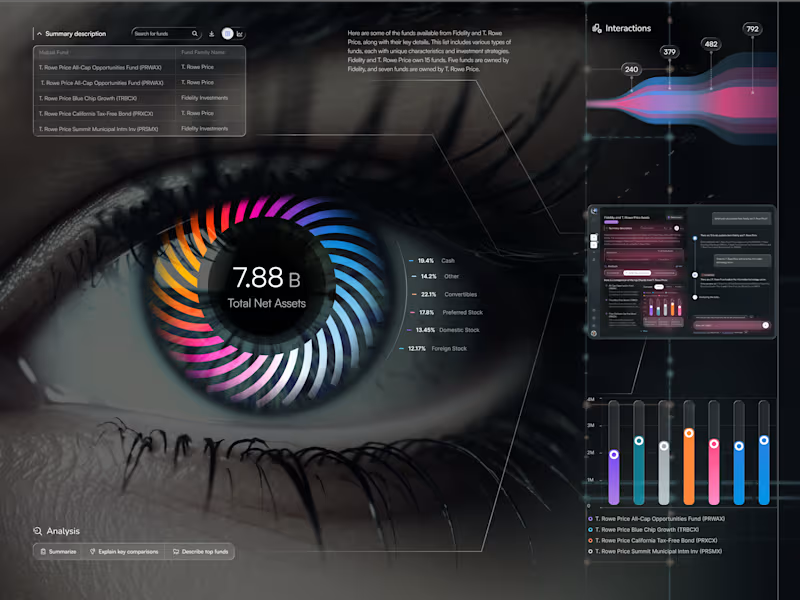
I’m excited to share EyeViz - a data-driven dashboard suite for exploring mutual funds through an artistic, human lens. ✨
👁️ Data You Can See (Eye Chart)
Meet the hero screen: a living iris where each colored blade maps an asset class, orbiting a bold KPI. It’s data-as-vision - instant clarity on allocation, balance, and momentum - with a slim Interactions stream and a built-in AI sidekick for quick explanations.
💡 Research Workspace
Search, compare, and understand — fast. Clean tables, smart chips, and a compact chart show stability, income focus, diversification, and risk side-by-side. The chat panel flags Unverified insights so trust stays front and center.
📱 Personal Workspace
Your everyday hub: activity tiles, pinned studies, and ongoing team chats - so you can jump back into work in seconds and keep insights reusable.
1
155
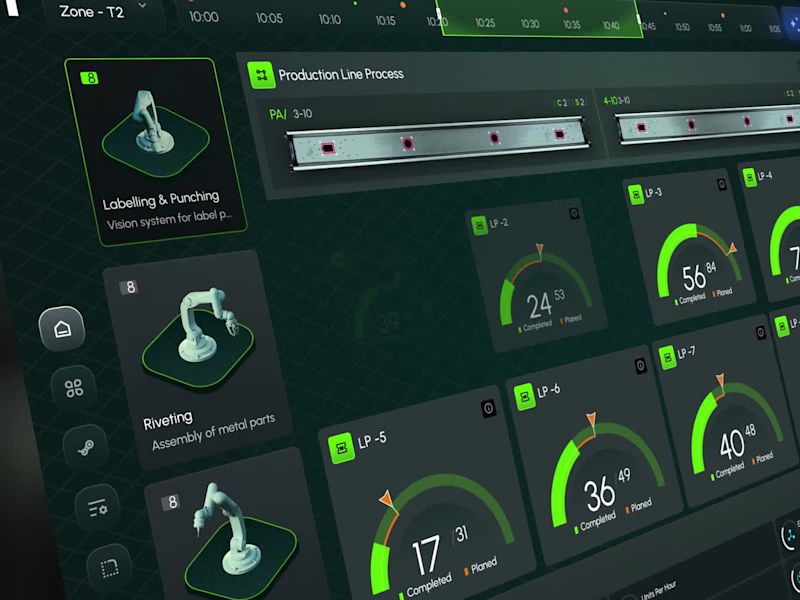
An animated interface designed to reflect the precision of industrial intelligence - a sleek, high-level dashboard built to orchestrate robotics, production analytics, and system-wide monitoring. From robot status indicators to real-time task flow and factory zone mapping, every visual layer is crafted for engineers who demand clarity at a glance and precision at scale.
Instant visibility across all production zones
Seamless integration of robotic systems
Performance insights delivered live
Designed for decisions - not just data
Welcome to the new standard in industrial UX: fast, focused, and fully connected.
22
369