Analyzing Ben’s Pizzeria: A Data Analysis Case Study
Aziz Ba Bakr
Useful Links:
GitHub Repository: https://github.com/abdulazizbabakr/Ben-s-Pizzeria/tree/main
Looker Studio Dashboard: https://lookerstudio.google.com/reporting/de5c8950-cc51-4534-b0a7-646f7a1badeb
(Note: The below blog is a summary of the SQL analysis conducted. For the complete code and detailed insights, please refer to my GitHub Repository in the Useful Links section above)
(Note: The below blog is a summary of the Looker Studio dashboard created. For the complete visual experience, please refer to the links provided above in the Useful Links section)
Introduction
In the world of gastronomy, understanding customer preferences, managing inventory, and optimizing staffing is pivotal to a successful restaurant business. In this data analysis case study, I delve into the operations of Ben’s Pizzeria, a fictitious pizzeria, to extract insights that drive strategic decision-making. Using SQL, I explore the intricacies of orders, ingredients, costs, and staffing through an engaging Google Looker dashboard.
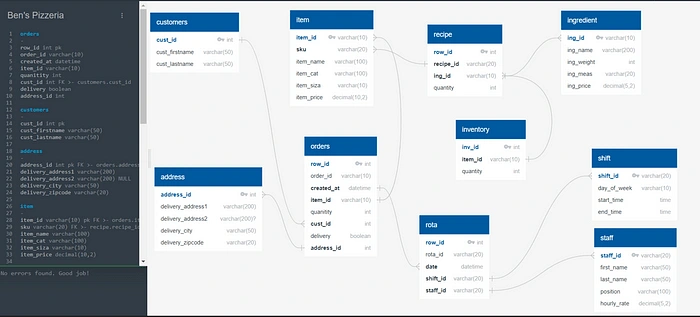
Sketching Tables and Data Modeling
My journey begins with sketching tables using Quick Database Diagrams. I meticulously designed the data model, capturing relationships between orders, items, addresses, recipes, ingredients, inventory, staff, rota, and shifts. This structured foundation forms the backbone of my analysis.
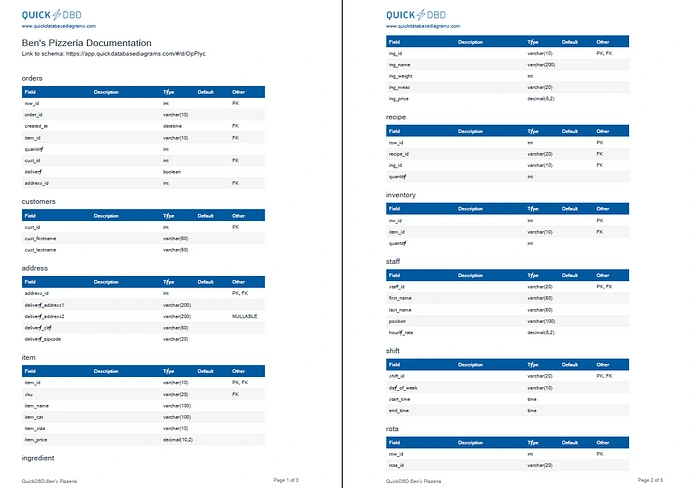
Formatting Data and Preparing Tables
After sketching, I formatted data in Excel to ensure consistency and accuracy. I then imported the curated tables into SQL for in-depth analysis.
Exploratory Data Analysis (EDA) using SQL
I embarked on my analysis by diving into SQL queries that unravel the story hidden in the data. Here are the core steps and queries that shaped my insights:
Dashboard 1: Order and Sales Insights
My first dashboard illuminates critical sales and order metrics. It offers a comprehensive view of total orders, sales, items sold, average order value, sales by category, top-selling items, orders by hour, sales by hour, and orders by address.
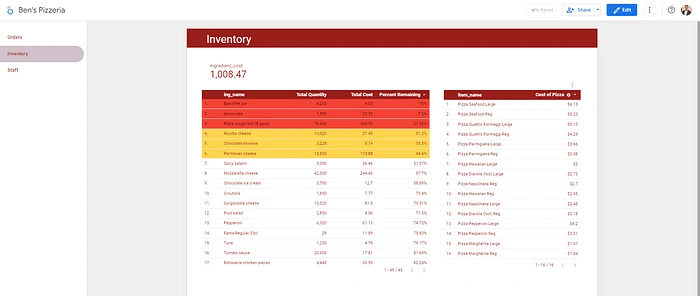
Dashboard 2: Ingredient Insights and Cost Analysis
The second dashboard delves into ingredient-level insights, costs, and inventory management. It breaks down total quantity by ingredients, total ingredient cost, calculated pizza cost, and percentage stock remaining by ingredient.
Dashboard 3: Staffing and Cost Management
My final dashboard focuses on staffing-related insights, showcasing total staff cost, hours worked, and staff details summary.
Incorporating Data Modeling for Accuracy and Reliability
Throughout my analysis, the foundation of my success rested on robust data modeling. I ensured that diverse datasets were seamlessly integrated, relationships were well-established, and data retrieval was efficient. This data modeling approach boosted the accuracy and reliability of insights derived from the dashboard.
Crafting Insights for Decision-Makers
My data-driven exploration of Ben’s Pizzeria highlights the prowess of SQL in extracting meaningful insights. From monitoring sales trends to optimizing ingredient costs and managing staffing, my analysis empowers restaurant managers to make informed decisions. The Google Looker dashboard further amplifies these insights, providing a dynamic platform for exploration and decision-making. As a case study, Ben’s Pizzeria serves as a testament to the transformative potential of data analysis in the culinary realm.
Google Looker Dashboard: A Visual Journey
My analysis of Ben’s Pizzeria extended to Google Looker, where I crafted a dynamic dashboard that presents data in visually engaging ways. While the intricate SQL queries laid the groundwork for my insights, the Looker dashboard complements the analysis by providing a holistic view of key metrics. Here’s a snapshot of my Looker dashboard:
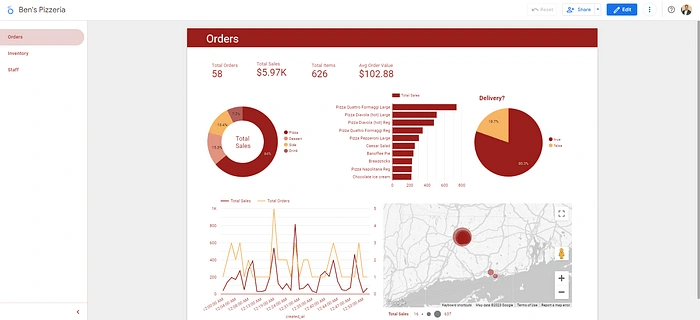
Dashboard 1 — Orders
My first Looker dashboard offers a visual representation of order-related insights. It highlights metrics like total orders, total sales, total items, and average order value. The pie chart showcases sales distribution by product, and the bar graph illustrates total sales by product subcategory. A pie chart further breaks down orders with and without delivery. The hourly line graph displays the flow of total orders and sales over time. Additionally, a map visually pinpoints order locations, offering a geographic perspective on order distribution.

Dashboard 2 — Inventory
The second Looker dashboard delves into inventory-related metrics. It visualizes ingredient costs, total quantity, total cost, and the percentage of remaining inventory. Additionally, it presents the cost of each pizza by calculating the ingredient cost. These visualizations empower the team to monitor inventory health and make informed decisions about ingredient procurement and usage.
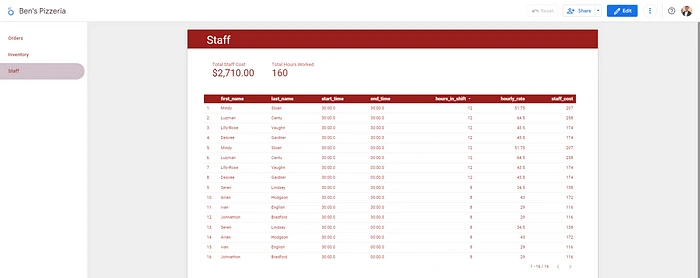
Dashboard 3 — Staff
The third Looker dashboard provides insights into staffing costs and hours worked. Visualizing staff costs, total hours worked, and other staffing details aids in optimizing workforce management. This visual summary assists in aligning staffing resources with peak hours of operation.
A Holistic Approach: Data Analysis and Visualization
The synergy between SQL analysis and Looker visualizations creates a comprehensive approach to extracting insights. The SQL queries meticulously unveil the data’s narrative, while the Looker dashboards present this narrative in visually appealing and digestible formats. This combined approach empowers decision-makers at Ben’s Pizzeria to take strategic actions based on a thorough understanding of sales trends, ingredient costs, staffing efficiency, and more.
Empowering Decision-Makers
In the culinary landscape, data-driven decision-making is the secret ingredient to success. My case study of Ben’s Pizzeria demonstrates how SQL and Google Looker can work in tandem to provide actionable insights. By analyzing data and visualizing it through dynamic dashboards, restaurant owners, managers, and stakeholders can steer their business toward higher efficiency, customer satisfaction, and profitability.
As I conclude my analysis of Ben’s Pizzeria, I’ve witnessed the transformative potential of data in the food industry. Whether through SQL analysis or interactive Looker dashboards, the story told by the data guides us toward smarter choices and a more satisfying dining experience.
Like this project
Posted Jan 28, 2025
In this data analysis case study, I delve into the operations of Ben’s Pizzeria, a fictitious pizzeria, to extract insights that drive strategic decision-making


