Exploring Customer Data for Profit Maximization
Aziz Ba Bakr
Exploring Customer Data for Profit Maximization: A Sprocket Central Case Study
Useful Links:
GitHub Repository: https://github.com/abdulazizbabakr/SprocketCentralProject/tree/main
Tableau Current vs Target Customers Analysis:
Tableau Executive Summary Dashboard:
Tableau Product Details Dashboard:
Tableau Customer Details Dashboard:
(Note: The below blog is a summary of the SQL analysis conducted. For the complete code and detailed insights, please refer to my GitHub Repository in the Useful Links section above)
(Note: The below blog is a summary of the Tableau dashboards created. For the complete visual experience, please refer to the links provided above in the Useful Links section)
Introduction:
I am thrilled to share my recent experience as a virtual intern with KPMG. Over the course of September 2023, I had the incredible opportunity to dive into the realm of data analytics, where I explored and honed my skills in various crucial aspects of the field.
During this internship, I delved into the intricacies of Data Quality Assessment, Data Insights, and the art of presenting data-driven findings. It was an enriching experience that allowed me to apply theoretical knowledge in a real-world context. I am excited to take you along on this journey as I recount the tasks, challenges, and insights I gained throughout this internship.
Let’s embark on this data-driven adventure together, where we’ll explore the importance of data quality, uncover actionable insights, and perfect the art of presenting data in a compelling manner. I hope that my experiences and learnings inspire you in your own data analytics endeavors.
In this case study, we will walk through SQL queries, data cleaning, normalization, and extensive exploratory data analysis (EDA) to gain actionable knowledge.

Task 1: Data Cleaning and Normalization
Step 1: Counting Columns
Our journey begins with understanding the structure of our data. We start by counting the number of columns in our dataset tables, specifically
CustomerDemographic, CustomerAddress, and Transactions.Step 2: Checking for Uniqueness
Duplicates can introduce noise into our analysis. We investigate duplicate records in the
customer_id and transaction_id columns.Step 3: Checking for NULLs
NULL values require special attention. We pinpoint columns with NULL values and implement appropriate handling. For example, we set
job_title to NULL when it’s labeled as ‘n/a’.Step 4: Checking for Empty Records
Empty records can be misleading. We ensure that no empty records are present in our data.
Step 5: Ensuring Consistency
Data consistency is key. We standardize gender and handle NULL values in the
job_industry_category.Step 6: Finalizing Tables
To enhance our analysis, we add an
age column to the CustomerDemographic table. We calculate ages based on the DOB and address an outlier where the customer age was exceptionally high.Task 2: Data Exploration and Model Development
Step 1: Adding Age Column in NewCustomerList
In our next step, we enrich the
NewCustomerList table by adding an age column. This will help us better understand the age distribution of new customers.Step 2: Calculating Profit in Transactions
Profit is a crucial metric. We add a
profit column to the Transactions table by subtracting standard_cost from list_price.Step 3: Creating Profit Bucketing based on Quartile
We classify transactions into profit quartiles to identify different levels of profitability.
Step 4: Updating the Above into the Table
We update the
Transactions table with the profit quartiles and sale categories.Step 5: Creating Age Buckets for CustomerDemographic and NewCustomerList
We segment customers by age to gain insights into different age groups’ profitability.
Task 3: Exploratory Data Analysis (EDA)
Now that our data is prepared, we embark on an EDA journey to extract insights that can drive profit maximization strategies.
Step 1: Profits by Job Industry Category
We begin by examining profits generated by different job industry categories.
Step 2: Profits by Job Title
Next, we explore profits associated with various job titles.
Step 3: Profits by State
We analyze profits based on the customers’ state of residence.
Step 4: Profits by Wealth Segment
We explore how profits vary across different wealth segments.
Step 5: Profits by Age Range
We segment customers by age range to understand how different age groups contribute to profits.
Interpretation
From our extensive data analysis, we draw several key conclusions that can guide profit maximization strategies:
1. Job Industry Matters: Manufacturing and Financial Services are the top contributors to profits.
2. Location Impact: New South Wales (NSW) generates more profits than the other two states combined.
3. Wealth Segment: Mass Customers yield the most profit compared to other segments.
4. Age Insights: Customers aged between 41–60 contribute more to profits, likely purchasing bikes for themselves or family members.
5. Brand Influence: The brands “WeareA2B” and “Solex” lead in profit generation, surpassing other brands significantly.
6. Management Matters: Managerial roles are associated with higher profit contributions.
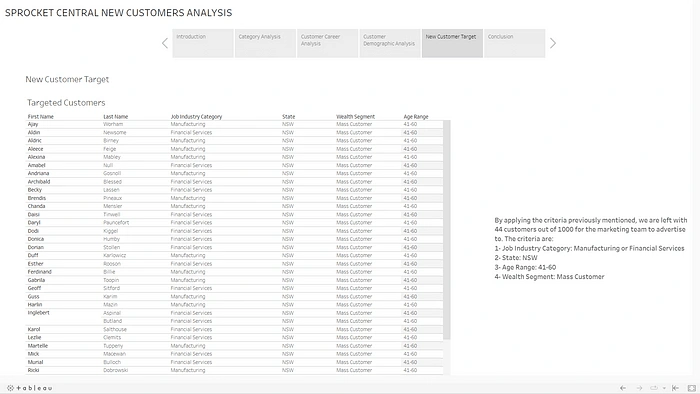
Targeting High-Profit Customers
To capitalize on these insights, we can target customers with characteristics associated with higher profits. For instance, focusing marketing efforts on Manufacturing and Financial Services professionals in NSW, aged between 41–60, and interested in brands like “WeareA2B” and “Solex” could yield the best results.
After conducting a thorough analysis, we’ve identified a group of 44 potential new customers who align perfectly with the criteria that have historically resulted in the highest profits for Sprocket Central. These individuals come from diverse backgrounds, with job industry categories spanning Manufacturing and Financial Services, both of which have consistently yielded substantial profits.
Moreover, a significant portion of these potential customers resides in New South Wales (NSW), the state that has consistently outperformed others in profit generation. This geographic concentration presents an exciting opportunity to expand Sprocket Central’s customer base in an area with a proven track record of success.
The wealth segment “Mass Customer” also dominates among these prospects, reflecting the segment that has historically contributed the most to the company’s bottom line. Additionally, the age range of 41–60 stands out, suggesting that this demographic has a higher likelihood of purchasing Sprocket Central’s products, either for themselves or their families.
While job titles among these prospects do not align precisely with the “Manager” roles that have proven profitable in the past, their job industry categories and other shared characteristics make them strong candidates for engagement.
In essence, this analysis unveils a promising group of potential customers who embody the traits and preferences associated with Sprocket Central’s most profitable clientele. It’s an opportunity to target an audience that has historically driven success for the company and could continue to do so in the future.
As we prepare to present these findings to the Sprocket Central team and client, we are excited about the potential for growth and profitability that this group represents. By leveraging data analytics and insights, we aim to assist Sprocket Central in making informed marketing and sales decisions that will propel the company toward even greater success.
Tableau Sprocket Central New Customers Analysis Story
Introduction
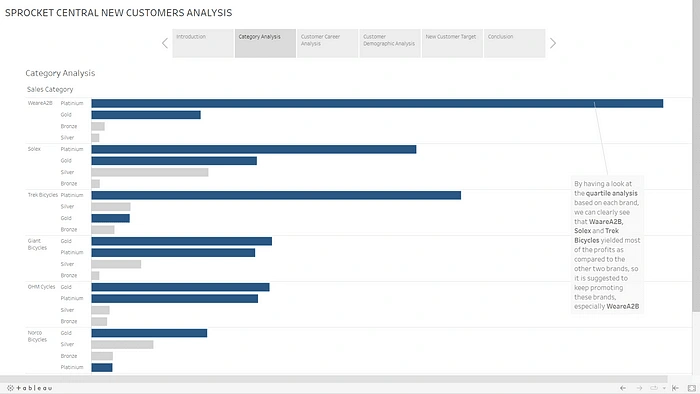
Category Analysis
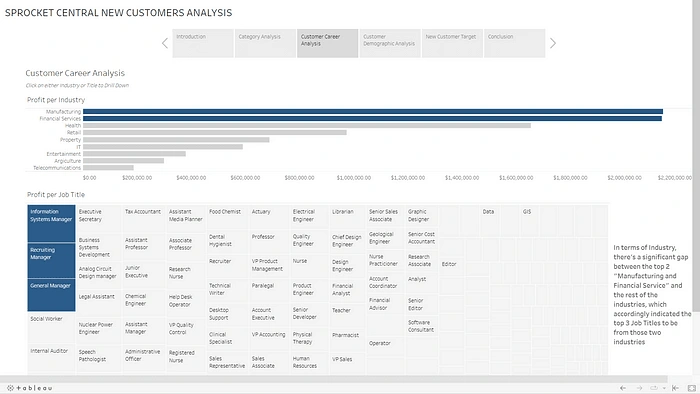
Customer Career Analysis
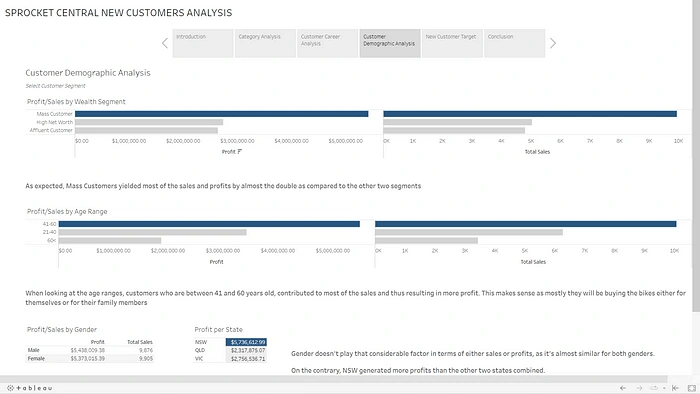
Customer Demographic Analysis
New Customer Target
Conclusion
BI Dashboards
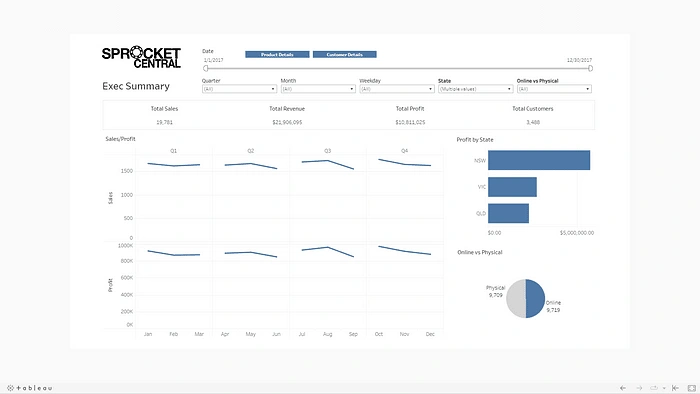
Executive Summary
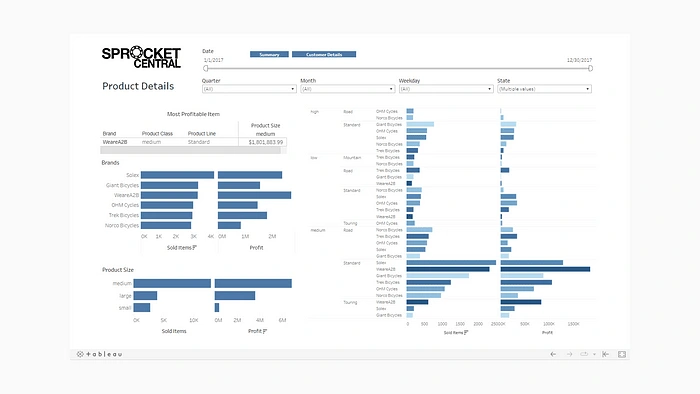
Product Details
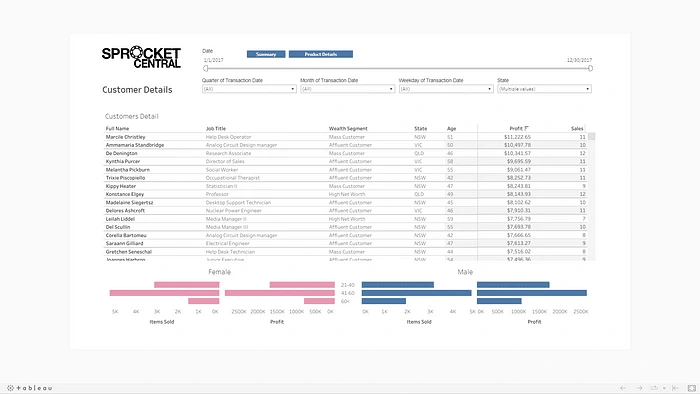
Customer Details
Conclusion
This concludes our data analysis journey, showcasing the power of data-driven decision-making for profit maximization. We hope this case study inspires you to explore your own data and unlock valuable insights for your business.
Like this project
Posted Jan 28, 2025
In this case study, we will walk through SQL queries, data cleaning, normalization, and extensive exploratory data analysis (EDA) to gain actionable knowledge.