Exploring AdventureWorks Dataset
Aziz Ba Bakr
Useful Links:
GitHub Repository: https://github.com/abdulazizbabakr/AdventureWorks/tree/main
Power BI Report File: https://drive.google.com/file/d/1gmj4Ahu1CXUgvzuO6ZYz8TuXMRGvTJwm/view?usp=sharing
(Note: The below blog is a summary of the SQL analysis conducted. For the complete code and detailed insights, please refer to my GitHub Repository in the Useful Links section above)
(Note: The below blog is a summary of the Power BI dashboard created. For the complete visual experience, please refer to the links provided above in the Useful Links section)
Introduction:
AdventureWorks is a widely-used sample database that simulates a fictional bicycle and accessory manufacturing company. In this comprehensive data analysis project, I will dive deep into the AdventureWorks database using SQL to extract valuable insights, answer business-related questions, and present my findings. I will cover various aspects of data analysis, including sales trends, customer behavior, and product performance.
Section 1: Sales Analysis:
In this section, I’ll analyze sales data to gain insights into the company’s revenue trends and customer preferences.
Subsection 1.1: Monthly Sales Trend:
I’ll examine the monthly sales trend for the year to identify any patterns or seasonality.
Subsection 1.2: Customer Segment Analysis:
I’ll categorize customers based on their buying behavior and analyze how different segments contribute to the company’s revenue.
Section 2: Product Analysis:
Here, I’ll focus on analyzing product performance and popularity.
Subsection 2.1: Best Selling Products:
I’ll identify the top-selling products in terms of revenue and quantity.
Subsection 2.2: Product Reviews vs. Ratings:
I’ll analyze the relationship between product reviews and ratings to understand customer satisfaction.
Section 3: Customer Analysis:
This section focuses on understanding customer behavior and demographics.
Subsection 3.1: Repeat Customers:
I’ll identify customers who have made multiple purchases and analyze their contribution to overall revenue.
Subsection 3.2: Age Group Analysis:
I’ll categorize customers into different age groups and analyze their buying patterns.
Power BI Dashboard Analysis Summary
My Power BI dashboard for AdventureWorks database offers a comprehensive analysis of various aspects to drive informed decision-making and provide key insights into the company’s performance.
Data Modeling:
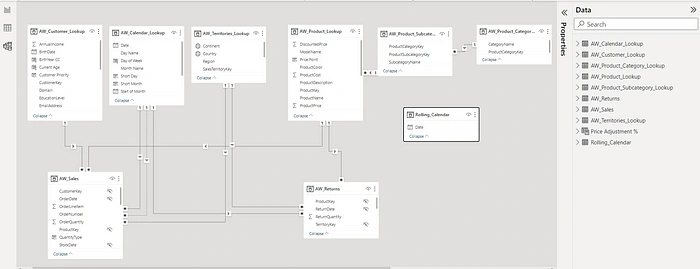
My analysis is supported by a robust data modeling approach that ensures the integration of diverse datasets, relationship establishment, and efficient data retrieval. This modeling enhances the accuracy and reliability of the insights derived from the dashboard.
This Power BI dashboard seamlessly integrates data from the AdventureWorks2019 database, offering a holistic view of sales trends, product performance, customer behavior, and more. The interactive elements and insightful visualizations empower users to explore, understand, and make informed decisions for the fictional bicycle and accessory manufacturing company.
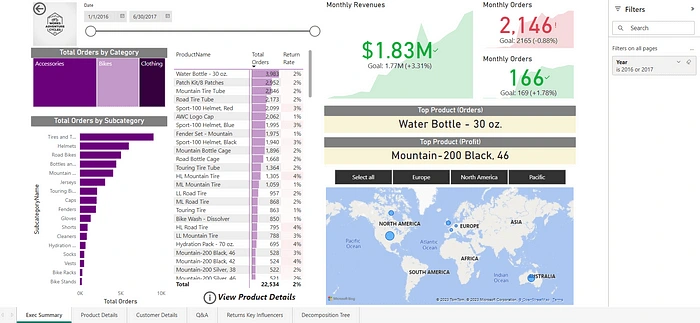
1st Page: Executive Summary
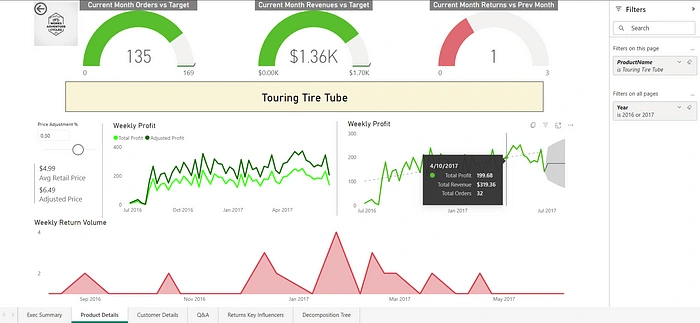
2nd Page: Product Details
Here, the spotlight shifts to product intricacies. Adjusted weekly profit and weekly profit line charts offer insights. A dynamic parameter for price adjustment sets the stage, while an area chart unveils weekly profits. Measures and custom columns create a rich analysis environment.
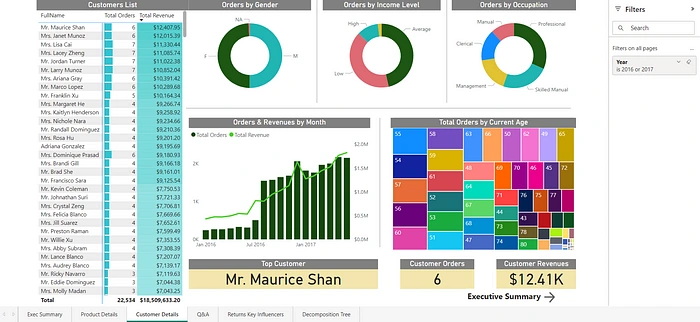
3rd Page: Customer Details
4th Page: Q&A
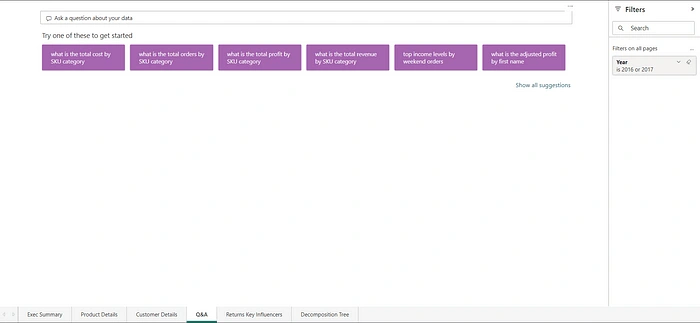
- AI Generated Questions and Answers: Allows users to pose questions and receive AI-generated answers based on the dataset.
5th Page: Returns Key Influencers
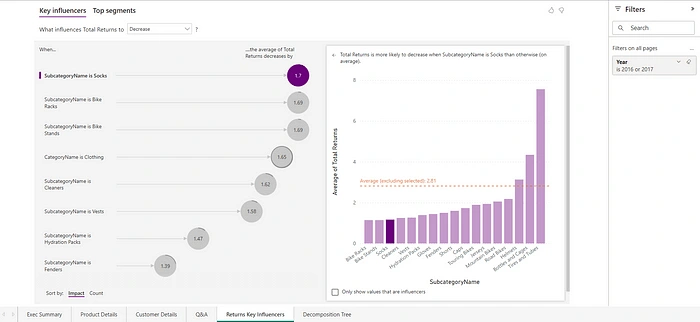
- Key Influencers for Product, Category, Subcategory: Identifies key factors influencing returns for product-related categories.
6th Page: Decomposition Tree
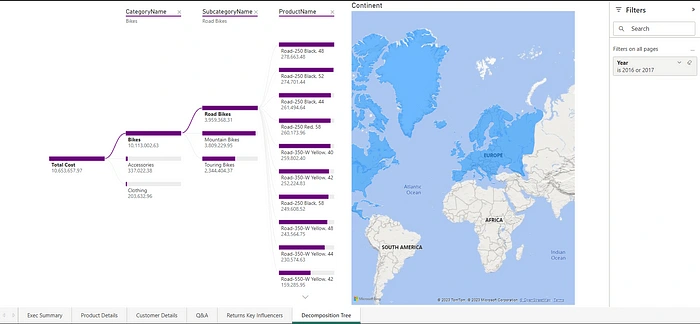
- Based on Total Cost: Visualizes the breakdown of total costs to explore influencing factors.
Conclusion:
Through a comprehensive analysis of the AdventureWorks database, I’ve gained valuable insights into sales trends, customer behavior, and product performance. By harnessing the capabilities of SQL queries, I extracted meaningful information that holds the potential to guide business decisions and strategies. This dual endeavor underscores SQL’s prowess in converting raw data into actionable insights for my fictional bicycle and accessory manufacturing company.
Furthermore, the Power BI dashboard seamlessly amalgamates data from AdventureWorks, providing a panoramic depiction of sales trends, product performance, and customer behavior. The interactive components and enlightening visualizations empower users to seamlessly explore, comprehend, and make well-informed decisions for the hypothetical bicycle and accessory manufacturing entity.
Like this project
Posted Jan 28, 2025
In this comprehensive data analysis project, I will dive deep into the AdventureWorks database using SQL to extract valuable insights


