Unveiling Cyclistic Bike-Share Insights Through Data Analysis
Aziz Ba Bakr
Useful Links:
GitHub Cyclistic Repository: https://github.com/abdulazizbabakr/Cyclistic
Power BI Report File: https://drive.google.com/file/d/1NW0ULTCMcOipL-9gLRtBVzTJ2adOcz0b/view?usp=sharing
(Note: The below blog is a summary of the SQL analysis conducted. For the complete code and detailed insights, please refer to my GitHub Repository in the Useful Links section above)
(Note: The below blog is a summary of the Power BI dashboard created. For the complete visual experience, please refer to the links provided above in the Useful Links section)
Introduction:
Cyclistic, a prominent bike-share program in Chicago, has evolved into a thriving network of over 5,800 bicycles across 692 stations. The company is eager to enhance its marketing strategy and maximize its annual membership base. This article delves into the data-driven journey of Cyclistic, exploring SQL queries and analytics to uncover valuable insights that can influence decision-making.
Combining and Cleaning Data:
The analysis began with consolidating Cyclistic’s ride data from multiple months in 2022 into a single table named “combined_data.” This step eliminated data fragmentation and enabled comprehensive analysis.
Data Integrity and Normalization:
Ensuring data integrity was vital. Negative ride durations were rectified, and duplicate records were addressed. Tables for ride types, stations, user categories, and calendar dates were created for comprehensive analysis.
Joining Tables for Enhanced Insights:
Merging the normalized tables provided a holistic view of ride data, encompassing factors like rideable type, day of the week, ride length, and user category. This enriched dataset facilitated deeper explorations.
Exploratory Data Analysis (EDA):
The EDA phase uncovered significant patterns. Average ride lengths, the distribution of ride durations, and preferences of member vs. casual riders were studied across months, days of the week, and hours.
Bike Usage Trends:
Key insights emerged, including bike preferences, average ride lengths, and trends in user categories. Data suggested that users preferred shorter rides, with casual riders contributing to a significant portion of the user base.
Monthly Insights:
Monthly analyses revealed seasonal trends, indicating increased bike usage during certain periods. These insights could inform marketing campaigns and station management strategies.
Day-of-Week Trends:
Day-of-week analysis exposed fluctuations in usage based on weekdays and weekends. It became evident that members and casual riders exhibit different usage patterns.
Hourly Usage Patterns:
Analyzing hourly usage patterns highlighted peak times when users accessed bikes. Insights into hourly trends could be leveraged for efficient bike redistribution and maintenance.
Segmented Ride Analysis:
Rides were categorized as short, average, or long based on their duration. This categorization revealed member and casual rider preferences for ride length.
Aggregated Summary:
The article concluded with a comprehensive summary of insights. Aggregated data on ride lengths, user categories, and preferred ride times were presented. This summarized view offered a holistic snapshot of Cyclistic’s bike-share program performance.
Conclusion:
By delving into Cyclistic’s historical ride data, this analysis unveiled valuable insights that can steer the company’s marketing strategies, optimize station management, and enhance user experiences. These insights serve as a testament to the power of data-driven decision-making in transforming a bike-sharing program’s success.
Power BI Visualization Report:
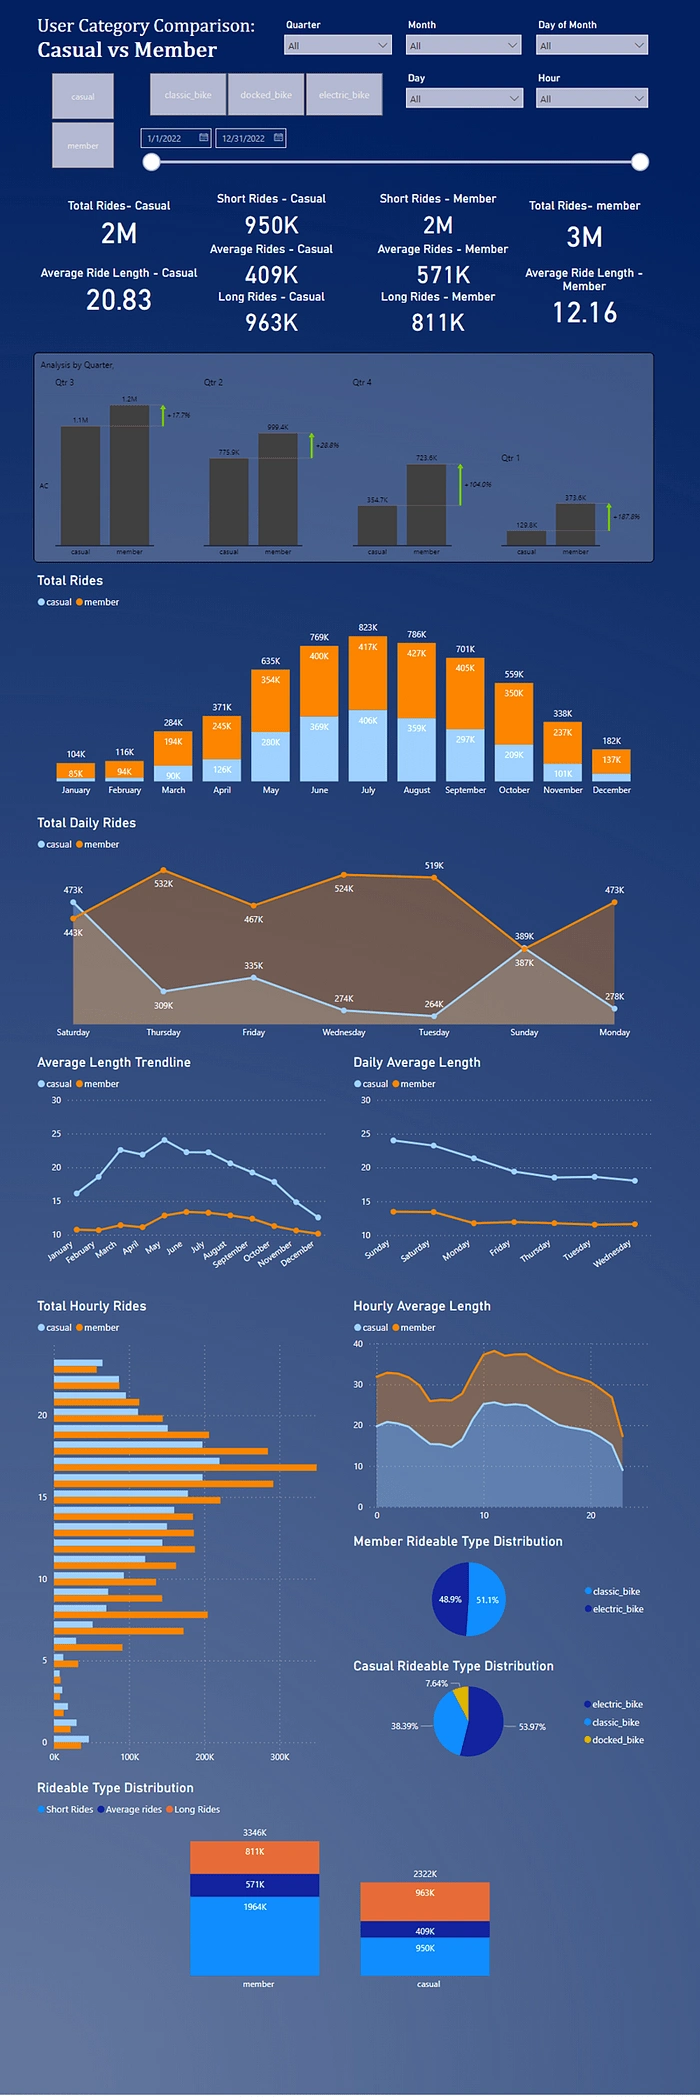
User Behavior Insights:
The Power BI report’s analysis of ride lengths over various time intervals — months, quarters, days of the week, and hours — has revealed significant engagement trends. This knowledge can be leveraged to maximize user interactions by targeting peak usage periods and tailoring promotions to these moments of heightened activity.
User Category Comparison:
The contrasting ride lengths and frequencies between member and casual users have unveiled distinctive preferences among these segments. Armed with this understanding, Cyclistic can strategize effectively to convert casual riders into annual members, thereby tapping into the superior profitability associated with the latter.
Rideable Type Preferences:
My examination of rideable type data has spotlighted the favored bike types among users. This granular understanding empowers Cyclistic to streamline bike inventory distribution across stations, ensuring that popular stations are well-stocked with the preferred bike models during periods of high demand.
Strategic Insights:
With my insights focused on converting casual riders into annual members, Cyclistic can optimize its marketing campaigns to align with this overarching goal. By directing resources towards transforming existing users into members, I can capitalize on their pre-existing awareness of Cyclistic’s program.
Data-Driven Decision-Making:
My analysis’s strength lies in its data-driven nature. The Power BI report provides the tools to explore data across various dimensions, allowing stakeholders to tailor analyses and gain deeper insights into user behavior, preferences, and engagement patterns.
Conclusion:
In conclusion, this Power BI report isn’t just a collection of charts and figures — it’s a gateway to transformation. Armed with these insights, Cyclistic can pave the way for increased ridership, enhanced user experiences, and operational efficiency. The data’s tale is told in the visuals, and the actions it beckons are bound to shape the future of Cyclistic in profound ways. By embracing data-driven decision-making, Cyclistic can truly pedal toward a future of growth and success.
Note:
The SQL queries and analyses mentioned in this article are based on the provided data and have been tailored for explanatory purposes. Actual results may vary based on the data’s quality and completeness. The article aims to showcase the methodology and approach to data analysis.
Like this project
Posted Jan 28, 2025
This article delves into the data-driven journey of Cyclistic, exploring SQL queries and analytics to uncover valuable insights that can help decision-making


