


What should I consider when defining project objectives for a data visualizer?
When setting objectives, focus on what you want to learn or show with the data. Be clear about your goals because this will guide the data visualizer. You should also think about who will see the visuals and how they will be used.
How should I determine the appropriate timeline for a data visualization project?
Think about how complex your project is. Talk with the data visualizer so they can tell you how much time they need. Give them enough time to do a great job but also check in to make sure things are on track.
What information should I provide to a data visualizer at the start?
Give them all the data they need to work with and explain what the data means. Also, share any special requirements or tools you want them to use. This helps them understand your project right from the start.
How can I ensure that my data visualizations will be user-friendly?
Think about the people who will use the visualizations. Are they familiar with data, or do they need simpler visuals? Share this with the data visualizer so they can create visuals that are clear and easy to use for your audience.
In what ways can I collaborate effectively with a data visualizer during the project?
Stay in touch with the data visualizer. Regular check-ins help catch any issues early. You should also be open to giving and receiving feedback to improve the project.
How do I assess the skills of a freelance data visualizer?
Look at their past work. This can show you their style and skills. Make sure they have experience with the type of data you need visualized.
What questions should I ask when agreeing on deliverables?
Ask about how many visuals you will get and in what formats. Make sure you know when each part will be delivered. This keeps everyone on the same page and avoids any surprises.
How can I ensure quality in the final data visualizations?
Set clear quality standards at the start. Ask for a sample or draft before the final version. This way, you know the final product will meet your expectations.
How should I address changes during the project?
Be clear from the start about how changes will be handled. Let the data visualizer know as soon as you want something changed. Keeping an open communication line is key.
What should I do if I'm new to working with data visualizers?
Start by learning the basics of data visualization. This helps you understand the work better. Talk to the data visualizer and be open about your level of experience so they can guide you through the process.
Who is Contra for?
Contra is designed for both freelancers (referred to as "independents") and clients. Freelancers can showcase their work, connect with clients, and manage projects commission-free. Clients can discover and hire top freelance talent for their projects.
What is the vision of Contra?
Contra aims to revolutionize the world of work by providing an all-in-one platform that empowers freelancers and clients to connect and collaborate seamlessly, eliminating traditional barriers and commission fees.
People also hire
Explore projects by Arabic-speaking Data Visualizers on Contra


Top services from Arabic-speaking Data Visualizers on Contra
MATLAB
Data Scientist
Data Analyst
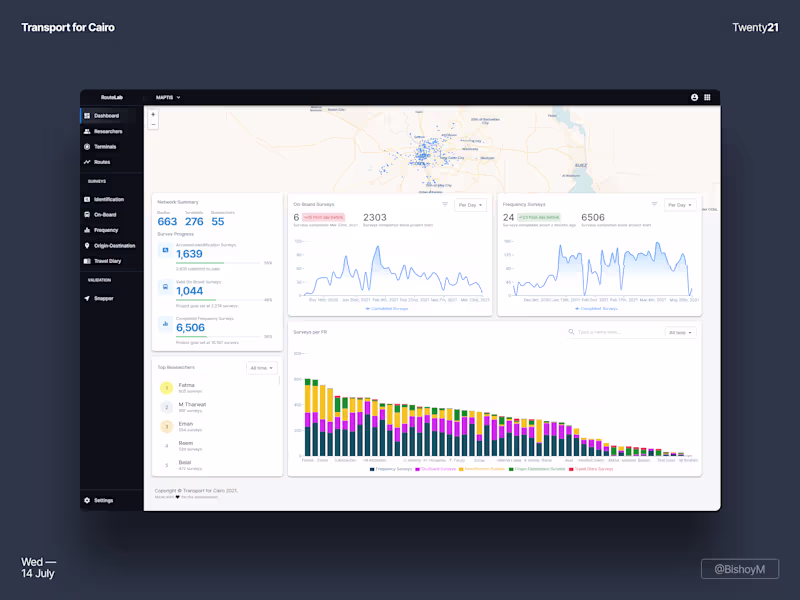
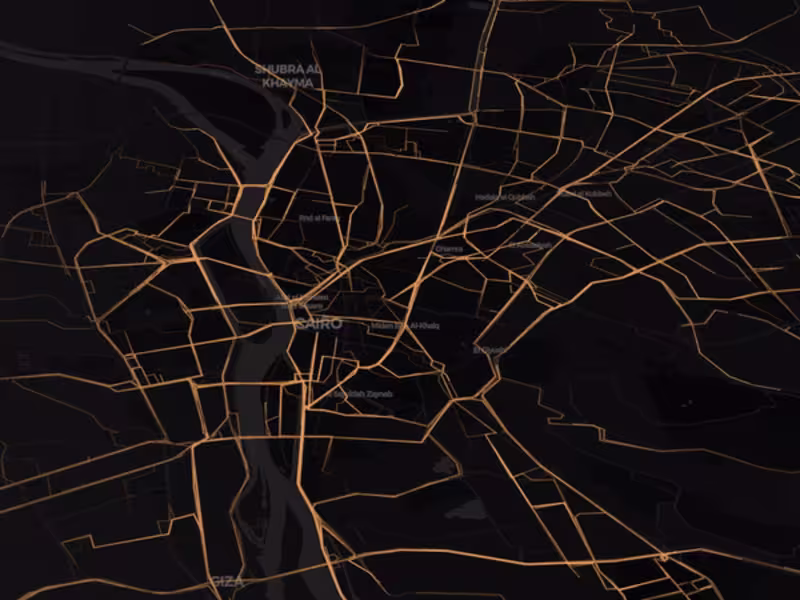
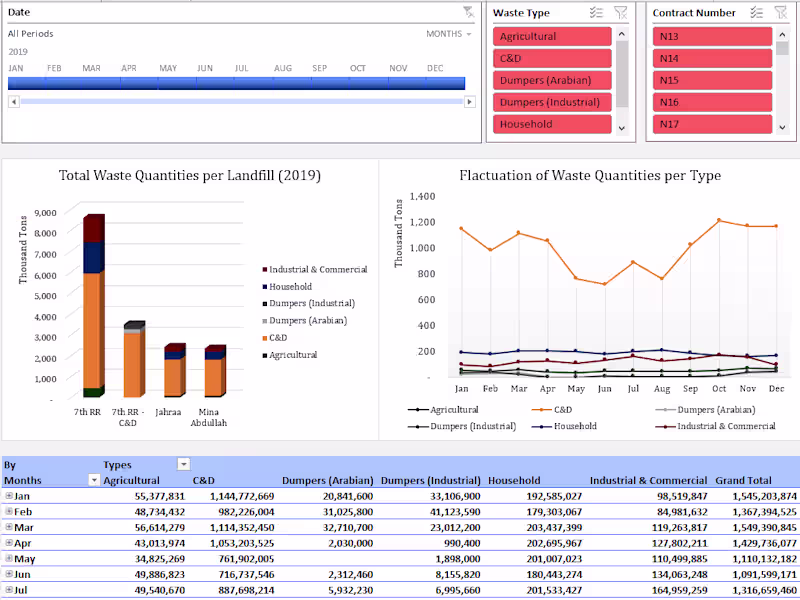
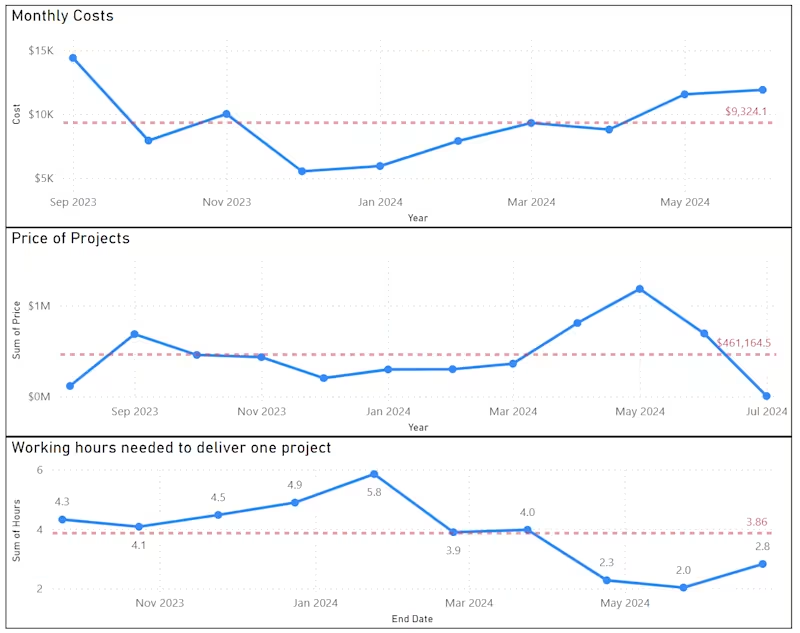
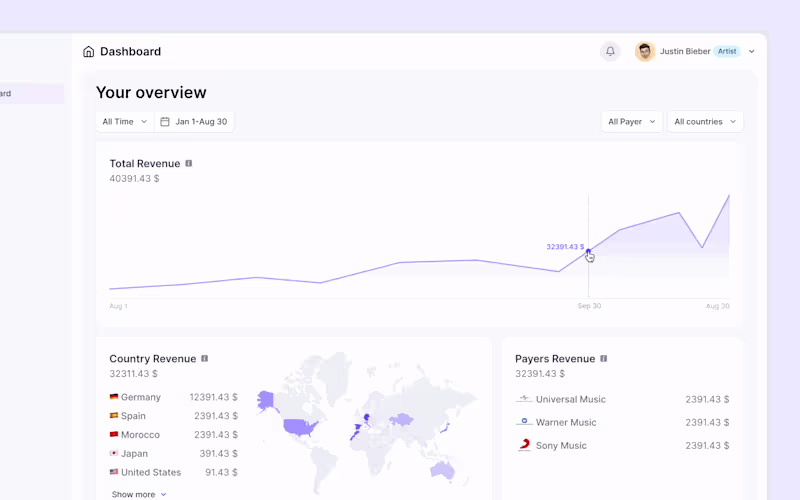
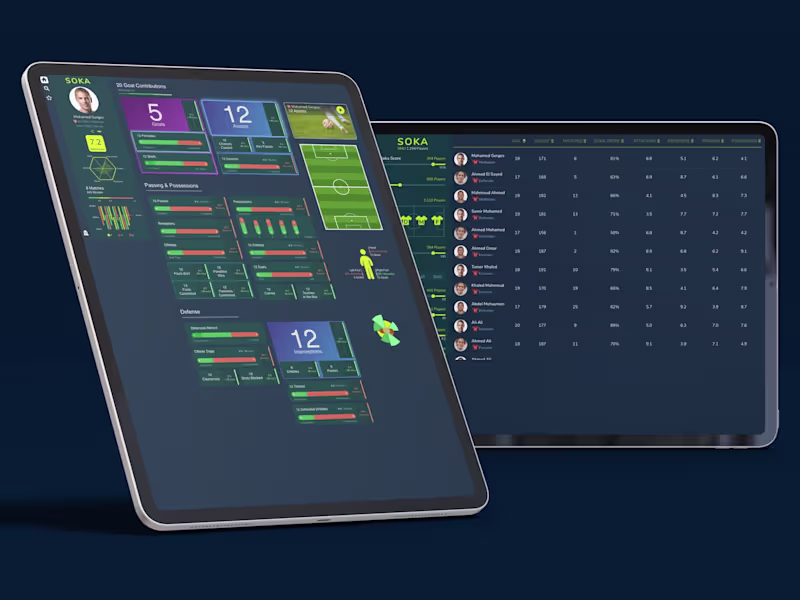
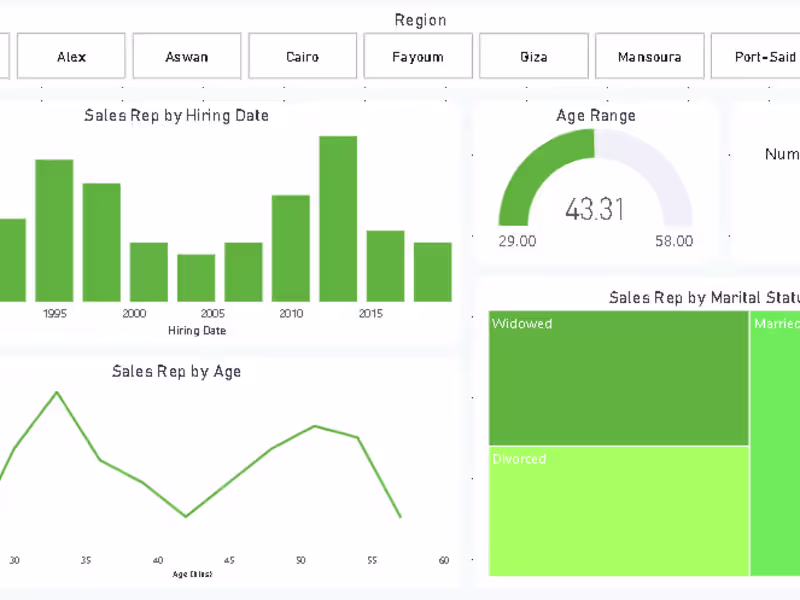
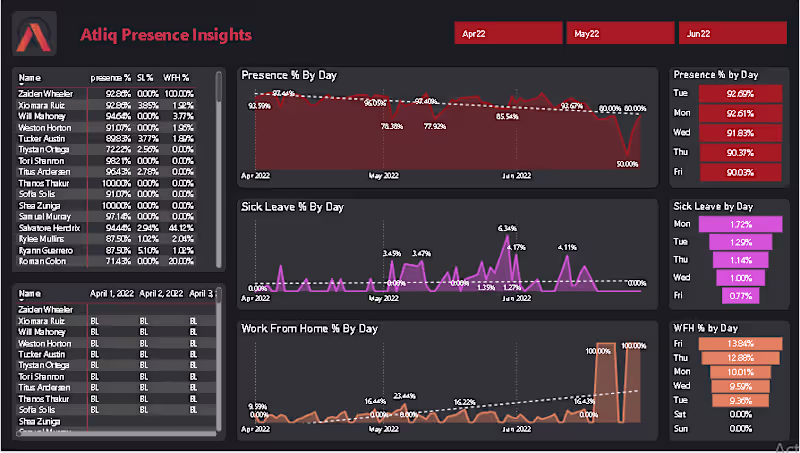
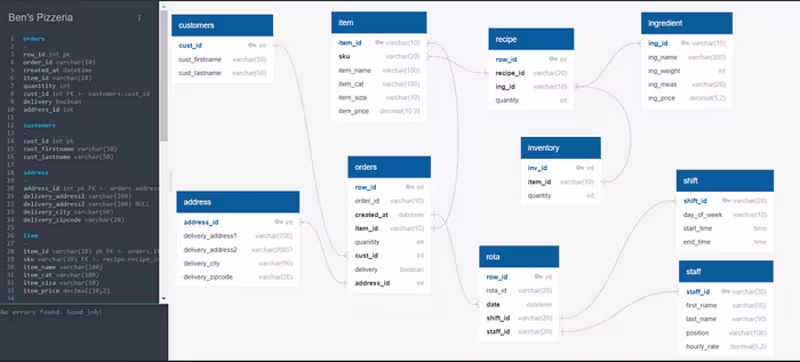
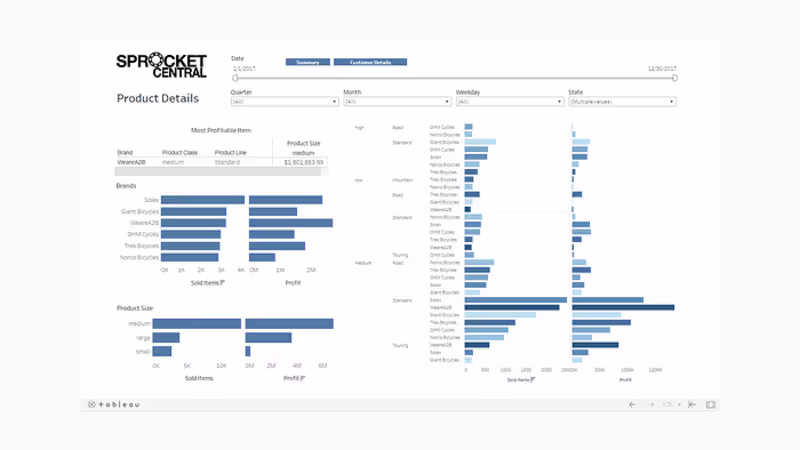
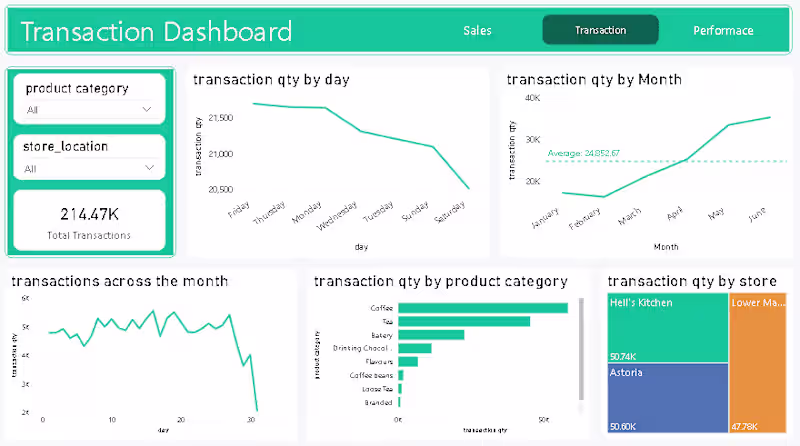
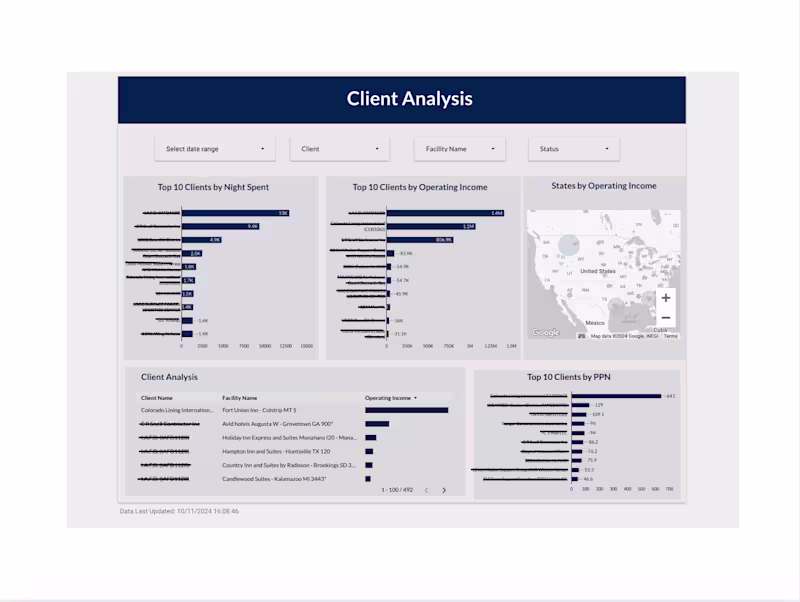
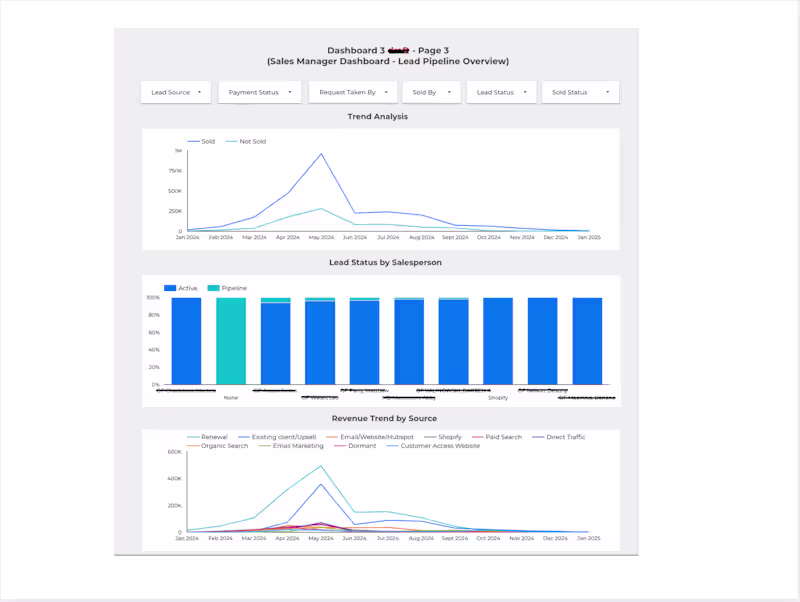
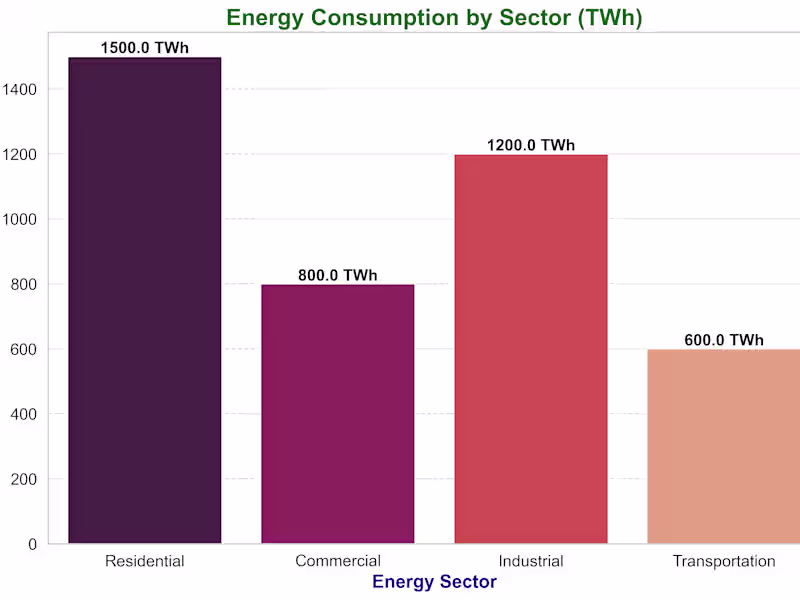
Transform Your Data into Compelling Visual Insights
Contact for pricing
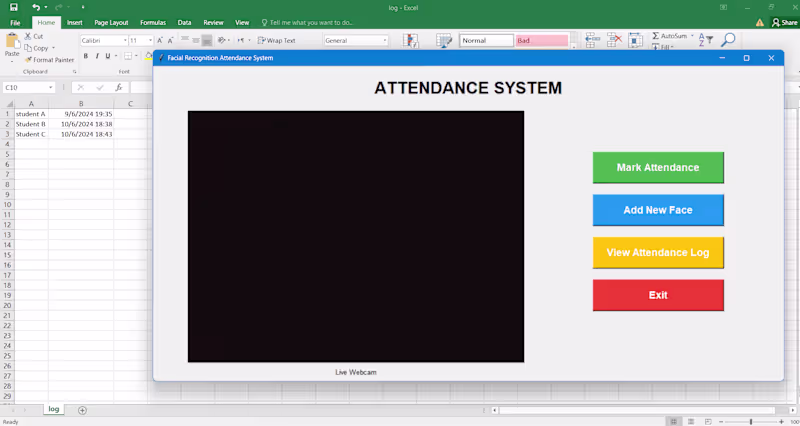
Excel VBA
Desktop Apps Development
Data Visualizer
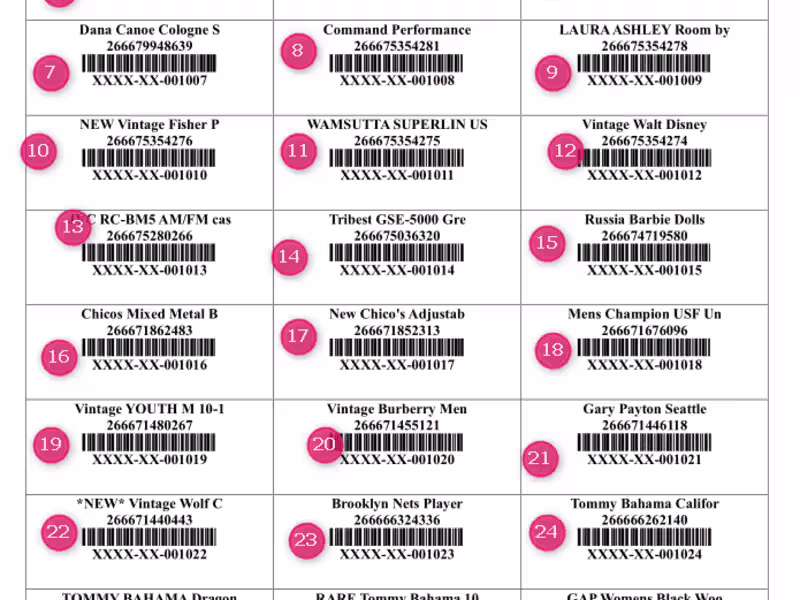
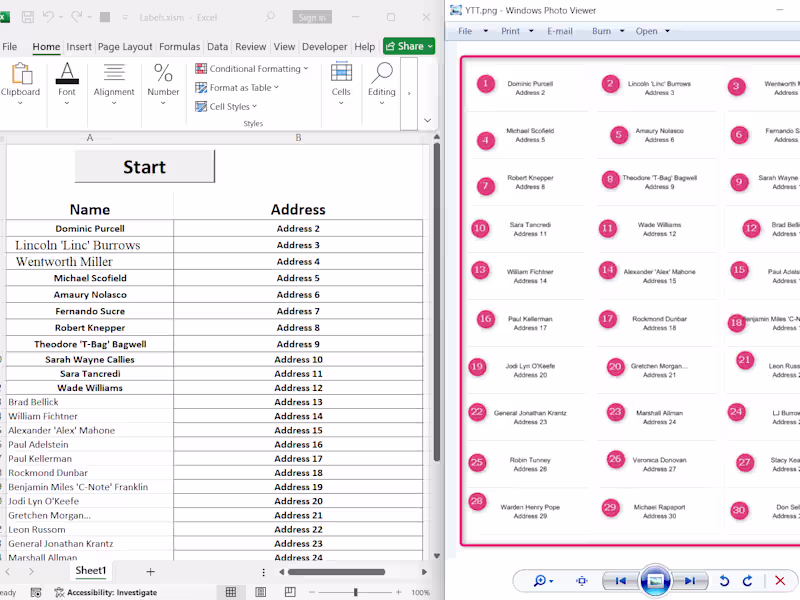
You will get an Excel app to label your data on Avery templates
$25
Google Sheets
Data Scientist
Data Analyst
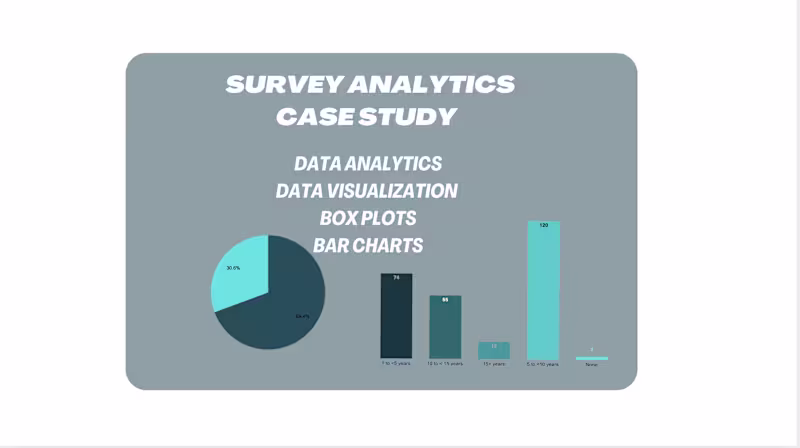
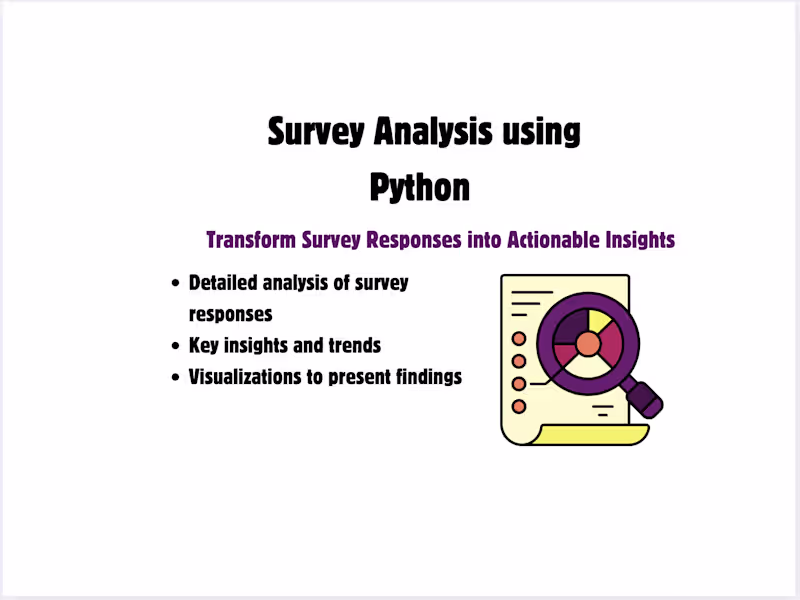
Survey Data Analysis & Visualization
Contact for pricing