
Transform Your Data into Compelling Visual InsightsMohammed Alsamdani
We offer tailored data visualization services that transform complex datasets into clear, interactive visual insights, empowering businesses to make informed decisions. What sets us apart is our focus on creating customized dashboards and visualizations that not only highlight key trends but also engage users, fostering a deeper understanding of their data. With a blend of analytical expertise and a user-centric approach, we ensure that our clients can easily explore and interpret their data for maximum impact.
What's included
Interactive Dashboards
Customized, user-friendly dashboards that allow clients to explore their data in real-time.
Data Visualizations
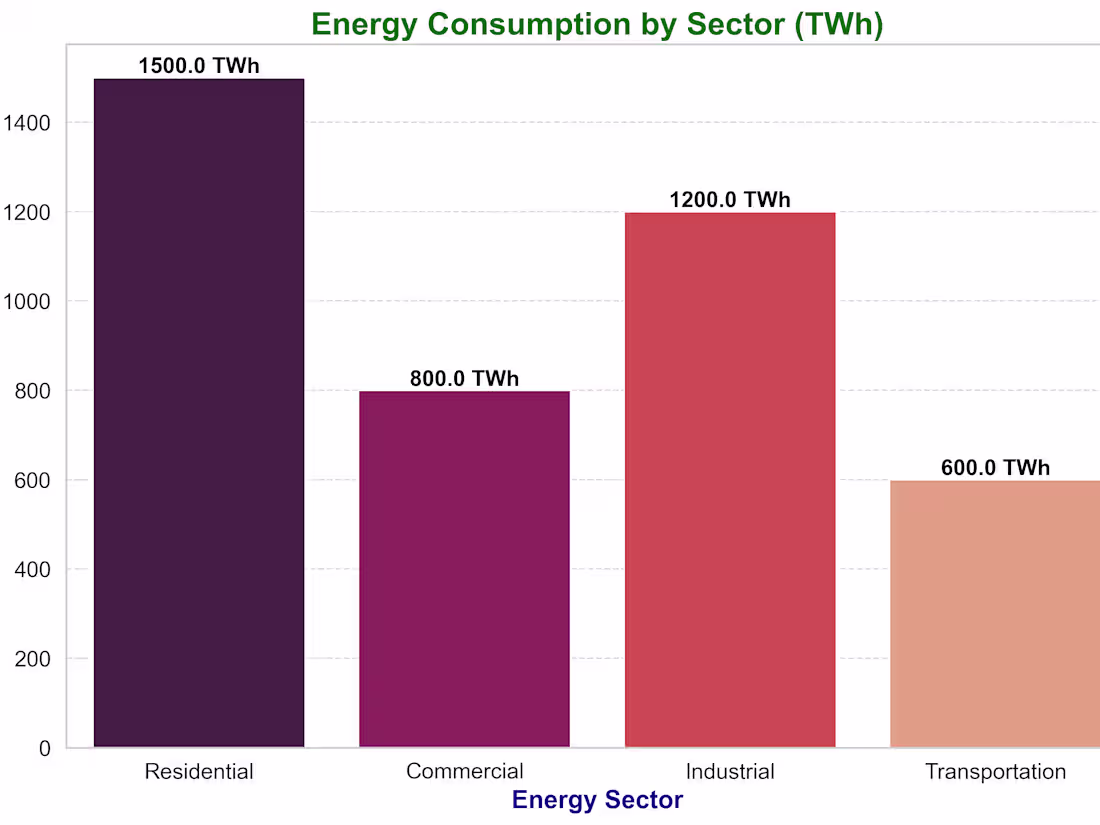
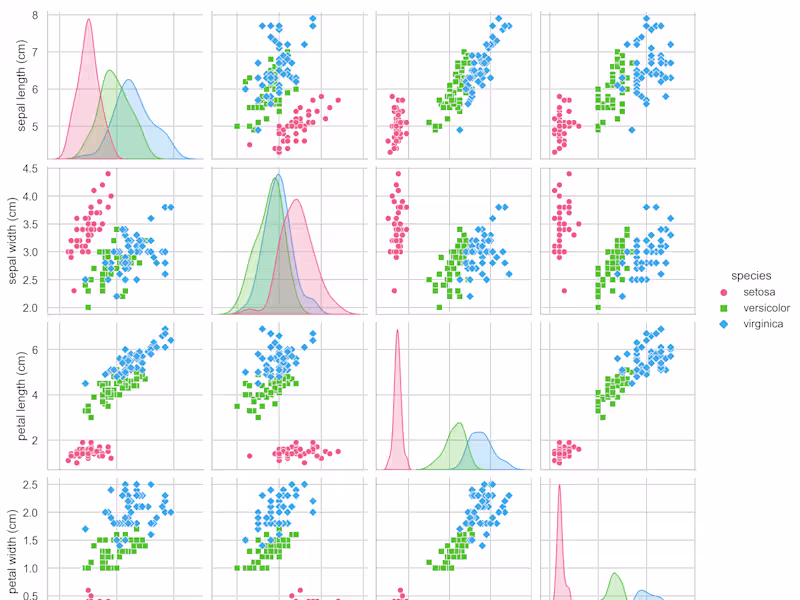
A set of visual representations (charts, graphs, maps) tailored to highlight key insights and trends in the data.
Data Analysis Report
A comprehensive report summarizing findings, patterns, and actionable insights derived from the data analysis
Presentation Materials
Slides or visual aids that can be used for stakeholder presentations, showcasing key findings and visualizations.
Source Code and Documentation
Well-commented code for the visualizations, along with documentation detailing how to interpret the visuals and use the dashboards.
Mohammed's other services
Contact for pricing
Tags
MATLAB
Matplotlib
Microsoft Excel
Microsoft Power BI
Tableau
Data Analyst
Data Scientist
Data Visualizer
Service provided by
Mohammed Alsamdani Denver, USA
- 1
- Followers
Transform Your Data into Compelling Visual InsightsMohammed Alsamdani
Contact for pricing
Tags
MATLAB
Matplotlib
Microsoft Excel
Microsoft Power BI
Tableau
Data Analyst
Data Scientist
Data Visualizer
We offer tailored data visualization services that transform complex datasets into clear, interactive visual insights, empowering businesses to make informed decisions. What sets us apart is our focus on creating customized dashboards and visualizations that not only highlight key trends but also engage users, fostering a deeper understanding of their data. With a blend of analytical expertise and a user-centric approach, we ensure that our clients can easily explore and interpret their data for maximum impact.
What's included
Interactive Dashboards
Customized, user-friendly dashboards that allow clients to explore their data in real-time.
Data Visualizations
A set of visual representations (charts, graphs, maps) tailored to highlight key insights and trends in the data.
Data Analysis Report
A comprehensive report summarizing findings, patterns, and actionable insights derived from the data analysis
Presentation Materials
Slides or visual aids that can be used for stakeholder presentations, showcasing key findings and visualizations.
Source Code and Documentation
Well-commented code for the visualizations, along with documentation detailing how to interpret the visuals and use the dashboards.
Mohammed's other services
Contact for pricing