Covid-19 Country Comparison
Johnny Aaron
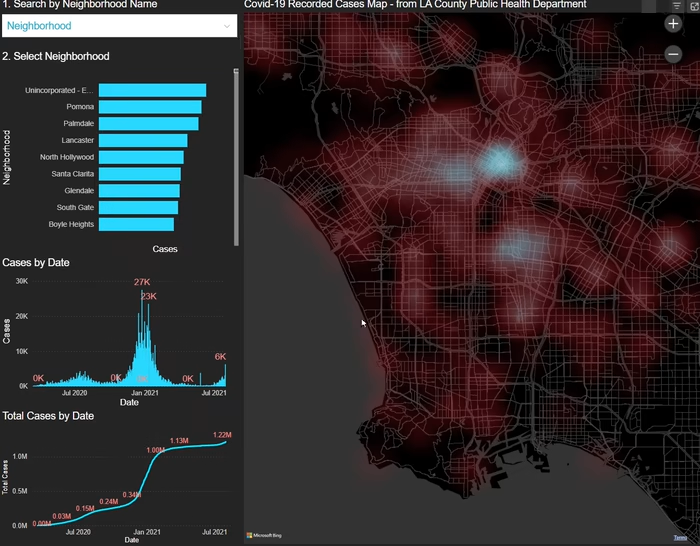
Collated various data sources to compare the raw and proportional impacts of Covid 19 between different countries, and how they relate to their GDP, Population, Density, and other factors. This project demonstrated the power that just a single table can have to convey a lot of information quickly.
Like this project
Posted Feb 7, 2025
Collated various data sources to compare the raw and proportional impacts of Covid 19 between different countries.