Sample Dashboard for Market Research Client
Johnny Aaron
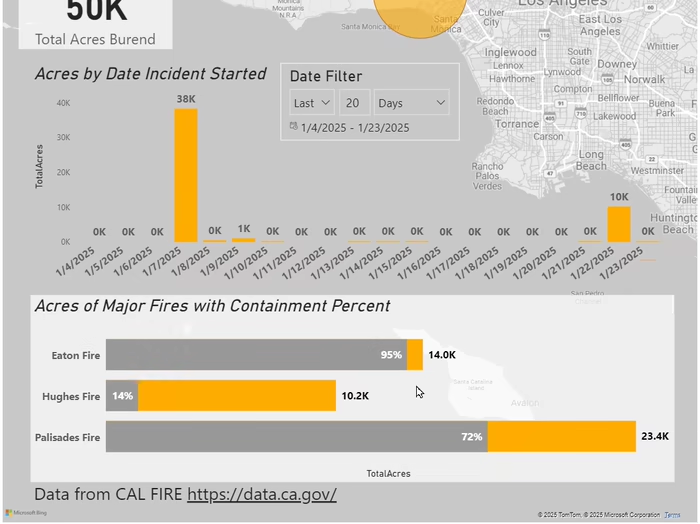
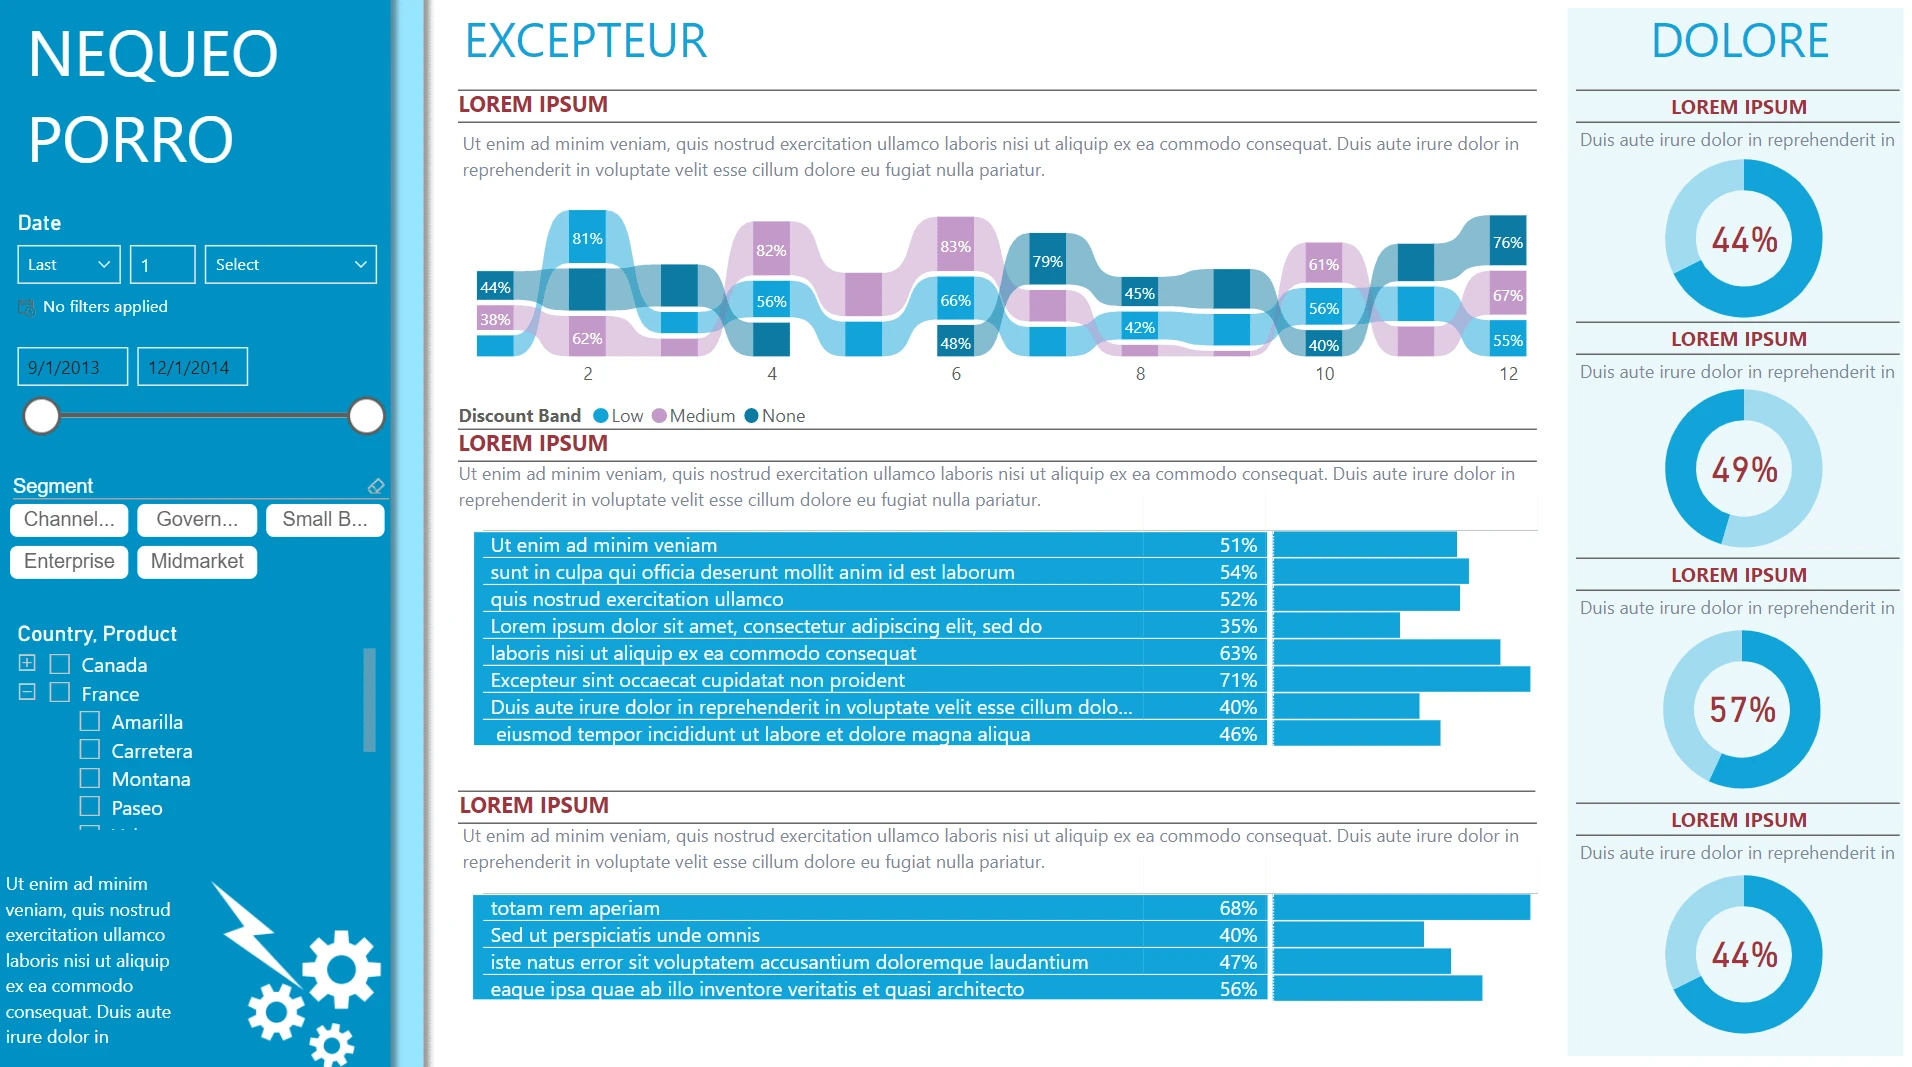
Just a sample Dashboard made for a client, with data and text anonymized with Lorem Ipsum. They needed some unusual visualizations. With long categories in the legend I separated out the categories into a table and used conditional formatting data bars to fill out a verticle bar chart effect instead. Opted for a Ribbon chart at the top to show competing categories for where Discounts could be applied.
Like this project
Posted Feb 7, 2025
Just a sample Dashboard made for a client, with data and text anonymized with Lorem Ipsum.
Likes
0
Views
8