L.A. Fires Interactive Power BI Dashboard
Johnny Aaron
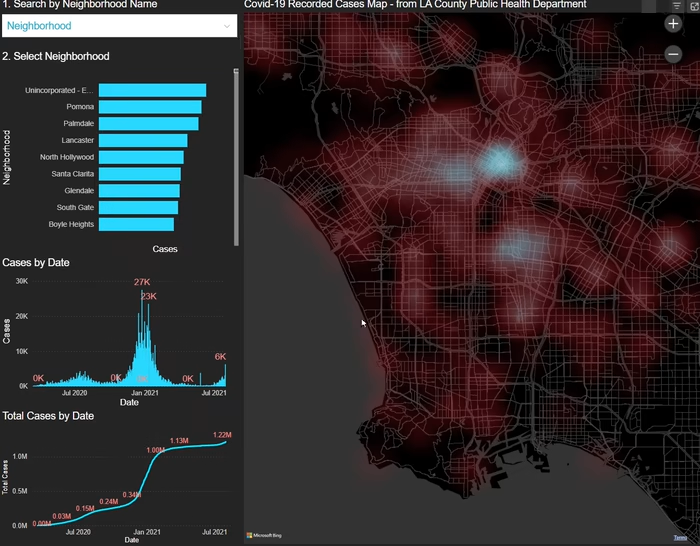
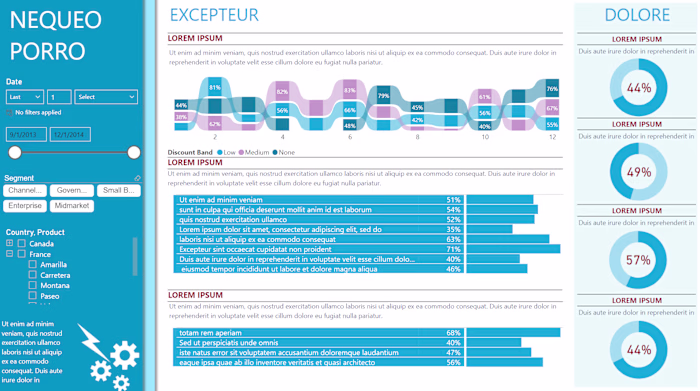
Made a Dashboard displaying where the historic and tragic Fires in LA were, their containment, acreage, and the dates they occurred. ". . . . Wildfires are a recurring part of life in Southern California, shaping both the landscape and the way communities respond to natural disasters. This interactive LA wildfire dashboard offers a data-driven look at fire activity from early 2025, highlighting total acres burned, major fire incidents, and containment progress. . ."
Like this project
Posted Feb 7, 2025
Made a Dashboard displaying where the historic and tragic Fires in LA were, their containment, acreage, and the dates they occurred.