Energy Profile Data Visualization
📈 Walter Jenkins
A group out of Connecticut focused on reducing the carbon footprint of the state contracted with me to develop and scope out a solution to visualize the data that they had been collecting and analyzing in excel.
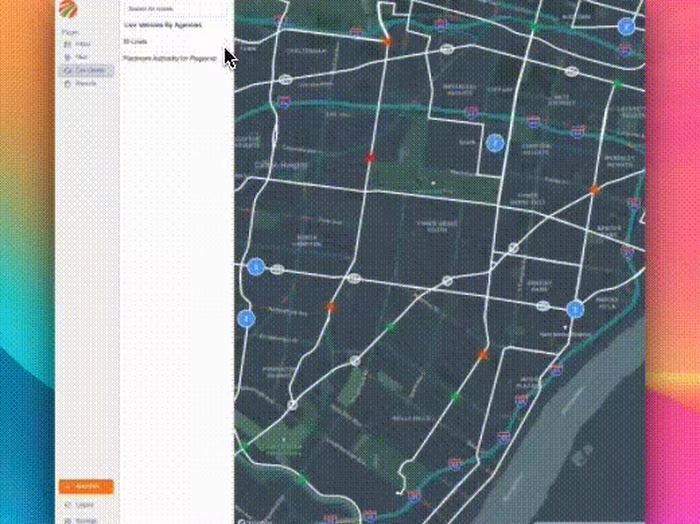
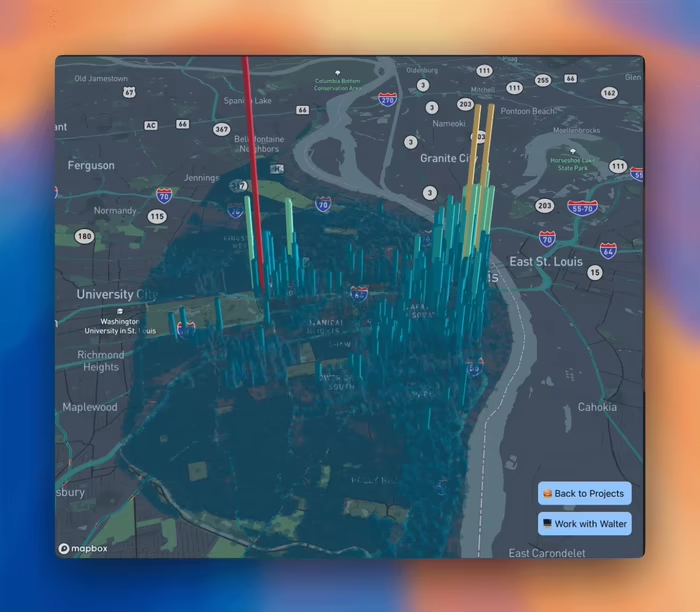
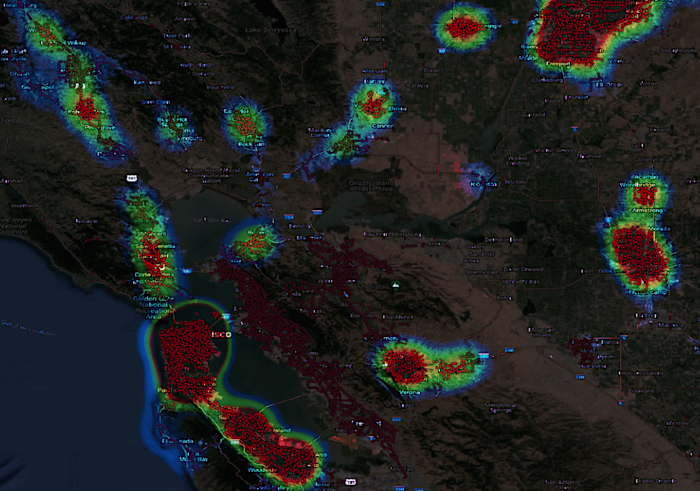
I worked with them to understand their issues closely and visualized their data using ChartJS and the ArcGIS JS Mapping API.
Like this project
Posted Aug 21, 2024
Analyzed and visualized excel data to display in a web application