From Spreadsheet Chaos to Executive Clarity
Francesco Stara
Funnel Dashboard Project: From Spreadsheet Chaos to Executive Clarity
When this project began, the client’s entire sales pipeline was tracked in Google Sheets, a common, low-cost solution. The spreadsheet included leads, sales reps, follow-up attempts, deal statuses, and payment outcomes, all mixed together with no consistent structure.
⚠️ The Problem
The client struggled with:
No clear way to understand conversion performance (Leads → Deals → Paying Customers)
No visual overview of where prospects were being lost in the funnel
Inconsistent data entries (e.g. missing dates, overlapping IDs, unclear statuses)
Static reports with zero interactivity or filterability
No concept of targets or benchmarks but only raw data
Despite collecting a decent amount of information, they had no system to make sense of it or use it to guide decisions. Every week was the same: export, clean, reformat, guess, repeat.
🛠 The Solution
Step 1: Data Audit and Problem Diagnosis
I started by auditing the Google Sheet and quickly found structural issues: duplicated records, missing timestamps, inconsistent text fields, and non-normalized columns (e.g. separate fields for each contact attempt). I split the sheet into three logical tables:
Leads: tracking rep, source, and initial status
Deals: tracking qualified opportunities and amounts
Payments: tracking outcomes and whether deals were monetized
This allowed me to build a clean foundation for a scalable data model.
Step 2: Data Transformation & Target Definition
Instead of jumping straight into Power BI, I performed the first round of cleaning and analysis directly in Google Sheets, correcting date inconsistencies, flagging missing fields, and defining custom columns like “conversion status” and “lead source breakdown.”
Then I introduced monthly target values for:
Total Leads
Total Deals
Paying Customers
Conversion Rates (Lead to Deal, Lead to Paying)
LTV (Lifetime Value per customer)
These became key benchmarks for performance measurement.
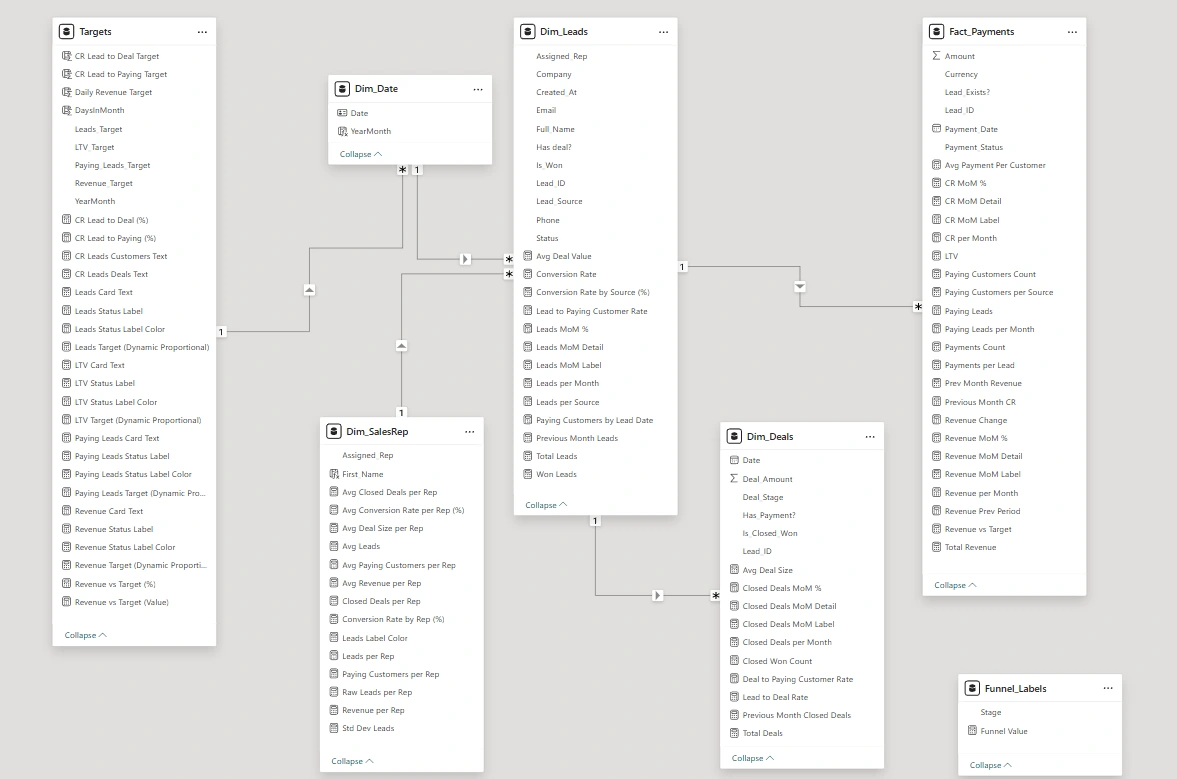
Step 3: Power BI Model & Relationships
With the structured tables in place, I loaded everything into Power BI and built a clean dimensional model using:
Tables: Leads, Deals, Payments, Date, Reps,
A dedicated “Targets” table to define expected KPIs (e.g. 600 leads/month, 25% CR).
Created dynamic measures that adapt to any date range, whether the user selects a full quarter or a single day.
Dynamic measures for CR, MoM comparisons, and filtered performance
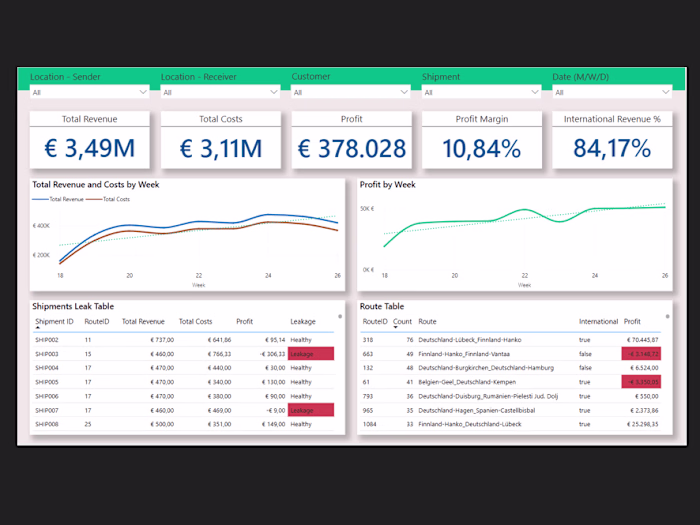
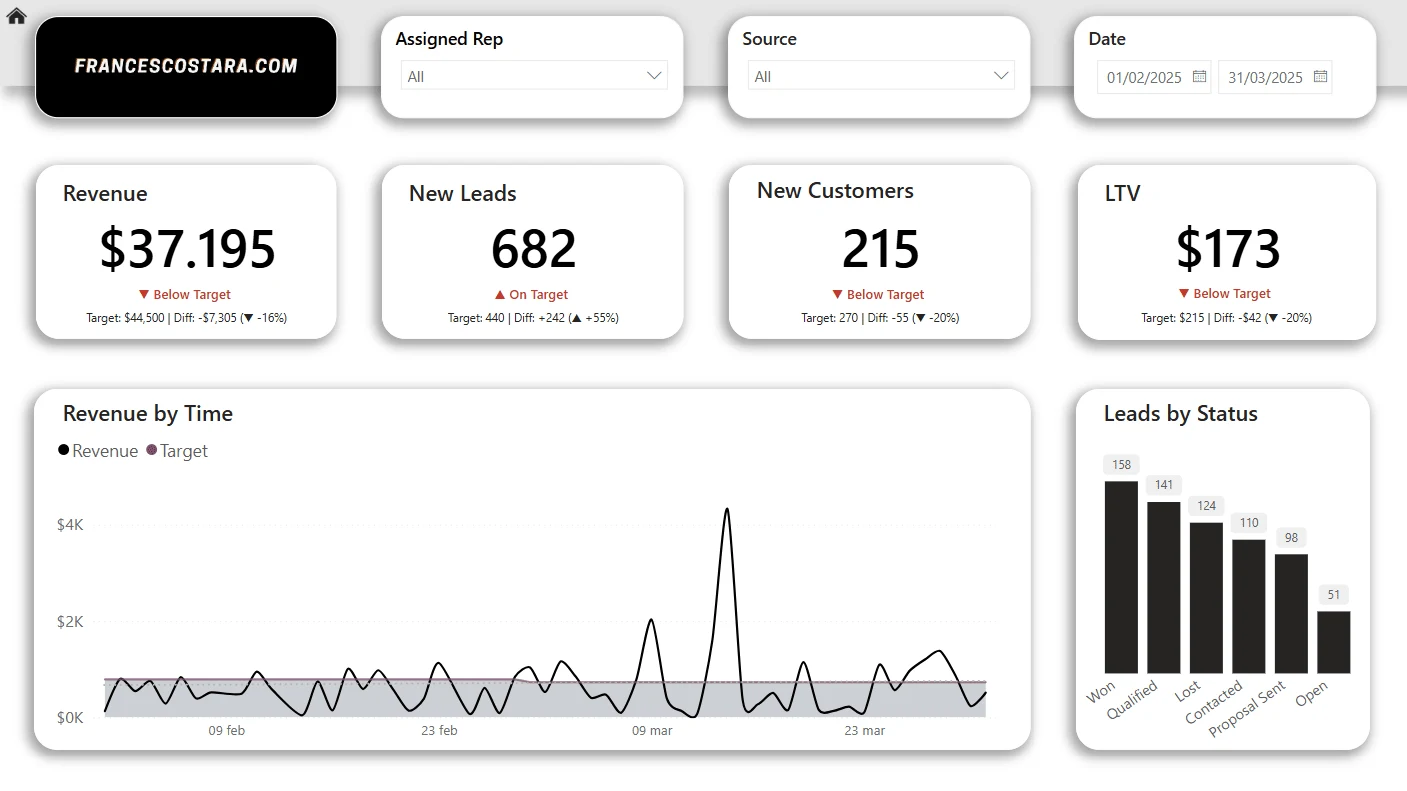
Step 4: Executive-Level KPI Dashboard
I created a clean Executive Overview Page including:
Dynamic KPIs for Revenue, Leads, Paying Customers, LTV
Targets that adjust automatically to any date range (day, week, month)
Conditional labels (🟢 On Target, 🔴 Below Target)
Smart commentary cards explaining differences in plain language
Responsive design elements styled like modern SaaS analytics tools
This let decision-makers see as soon as they open the dashboard how the sales engine was performing, and whether they were above or below benchmarks.
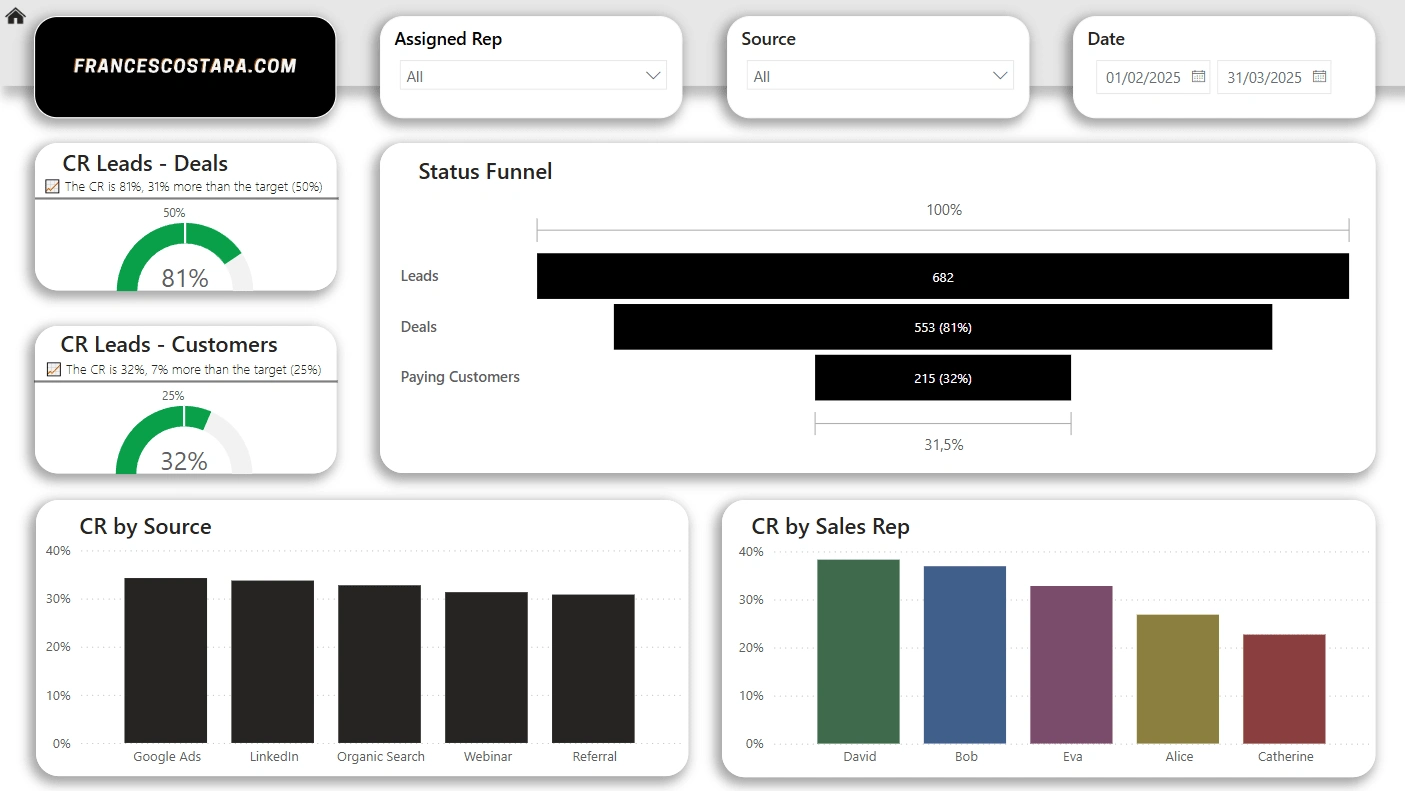
Step 5: Funnel Page with Performance Analysis
Next, I built a dedicated Funnel Page visualizing the journey from Lead → Deal → Paying Customer.
Key features included:
Clean bar-based funnel with percentages at each step
Dynamic conversion rate cards with monthly targets
Gauge visuals showing CR vs. goals
Drillable breakdowns by sales rep and source
Interactive elements so stakeholders could ask "Where are we losing leads?" and get instant answers
I also added detailed textual summaries under the gauges, showing whether they were "📉 7% below target" or "📈 4% above" — to make it more understandable to business stakeholders.
Step 6: Other Pages
To track performance trends over time, I created:
A MoM card section with sparklines and performance deltas
e.g. Revenue ▲75%, Deals ▲40%
Dynamic period comparison for previous month, including:
Feb: $13,528 | Mar: $23,667 | Var: +$10,139
Revenue evolution visual by sales rep
This made it easy to tell not just how things are now, but how they’ve changed.
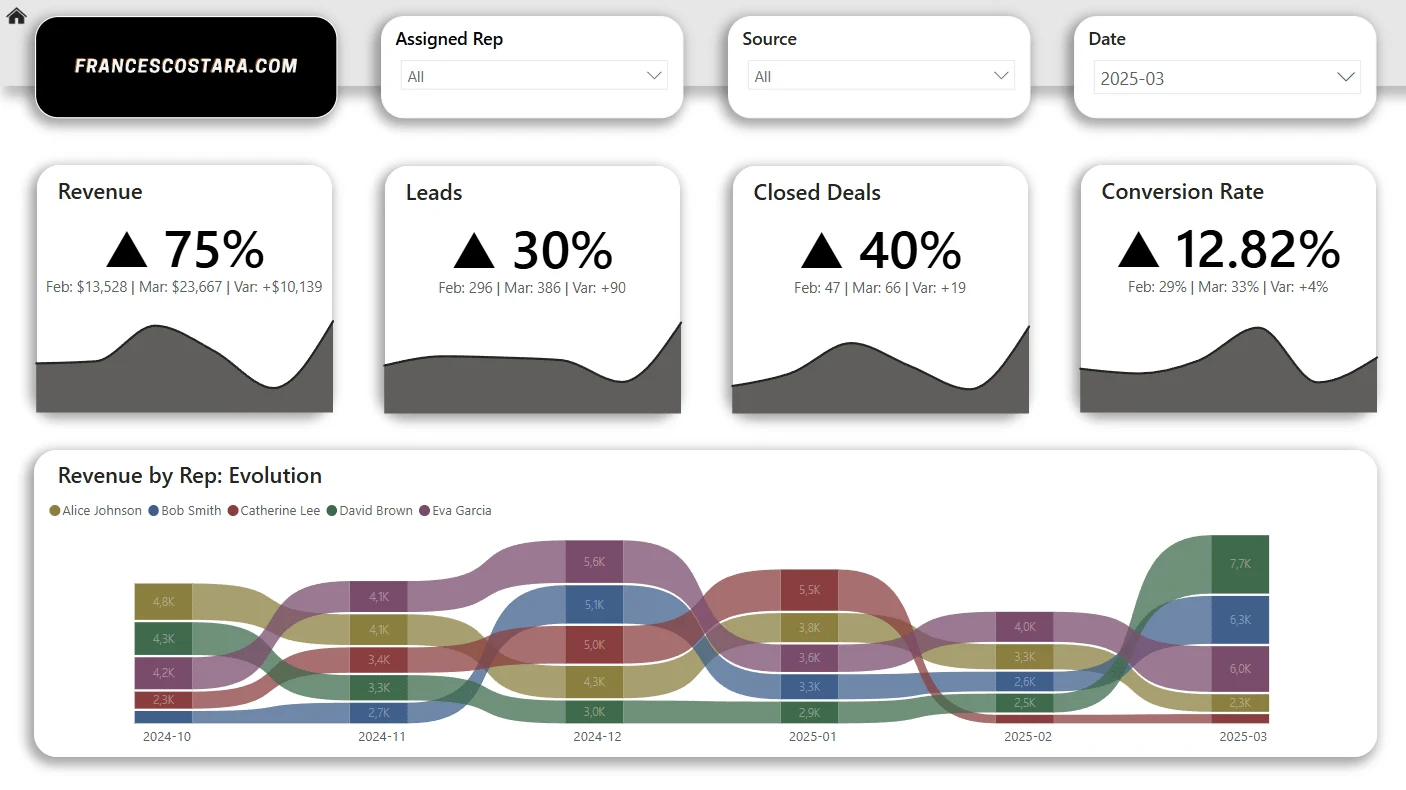
Month Over Month Comparison
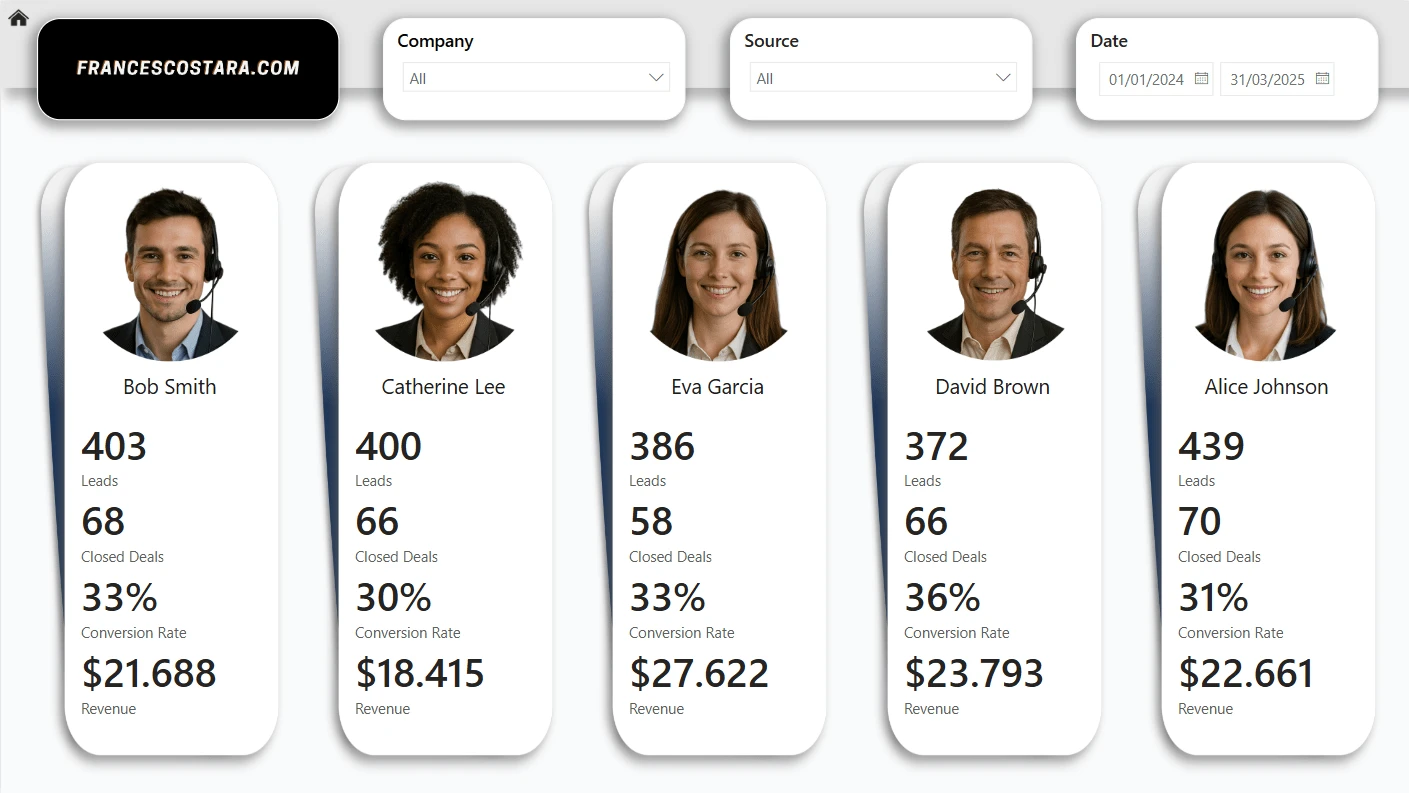
To support rep coaching and accountability, I added two pages:
Reps Info Page
Individual rep cards with:
Leads, Deals, Conversion Rate, Revenue
Visual alignment with brand
Used as a “rep profile” page for reviews
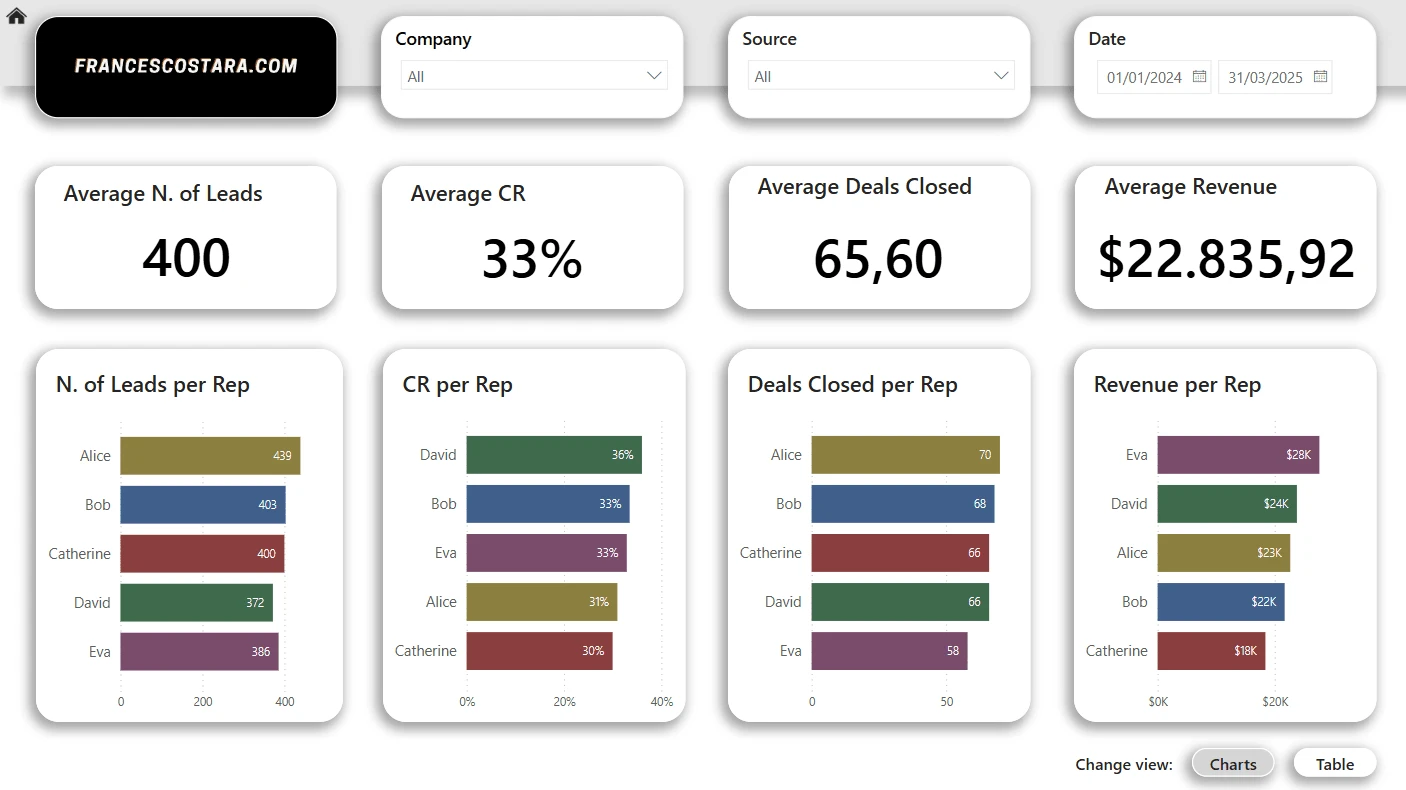
Reps Performance Overview
Tables and charts by rep:
Avg deal size, CR, revenue
Conditional formatting on CR and revenue to highlight outliers
KPIs compared to benchmarks per rep
These tools gave managers insight into who was overperforming or falling behind.
Sales Reps Info
Sales Reps Overview
Final Result
The final solution turned a messy, manual spreadsheet into a professional reporting system that delivers:
Instant insight into sales performance
Clarity on how well leads are converting
Confidence in data-driven decision-making
A tool stakeholders now use daily to monitor targets and optimize performance
💬 Why This Matters to Business Stakeholders
This wasn’t just a dashboard project — it was a full transformation of how the team understands and interacts with their sales data.
By aligning data structure, business goals, and visual clarity, I helped the client go from data overload to data confidence — saving hours of manual work and enabling smarter decisions, faster.
🔧 Behind the Scenes: Custom KPIs and Model Additions
To support this dashboard:
I built over 50 custom DAX measures
Introduced a Targets table with monthly goals
Created dynamic DAX to:
Show differences between actual and expected values
Label performance (On Target / Below Target)
Show monthly-adjusted proportional targets
Optimized relationships across 7 linked tables
Ensured measures respond to any filter (day, week, rep, source)
Like this project
Posted Apr 18, 2025
Transformed chaotic sales data from messy Google Sheets into a clear, interactive Power BI dashboard.