Logistics: Power BI
Francesco Stara

Explore my portfolio here: https://francescostara.com/.
Client Problem: The operations team of a logistics company suspected irregularities in revenue and cost data for May and June 2024. They needed a clear, interactive Power BI dashboard to identify:
Potential revenue leakage
Inefficient routes or customers
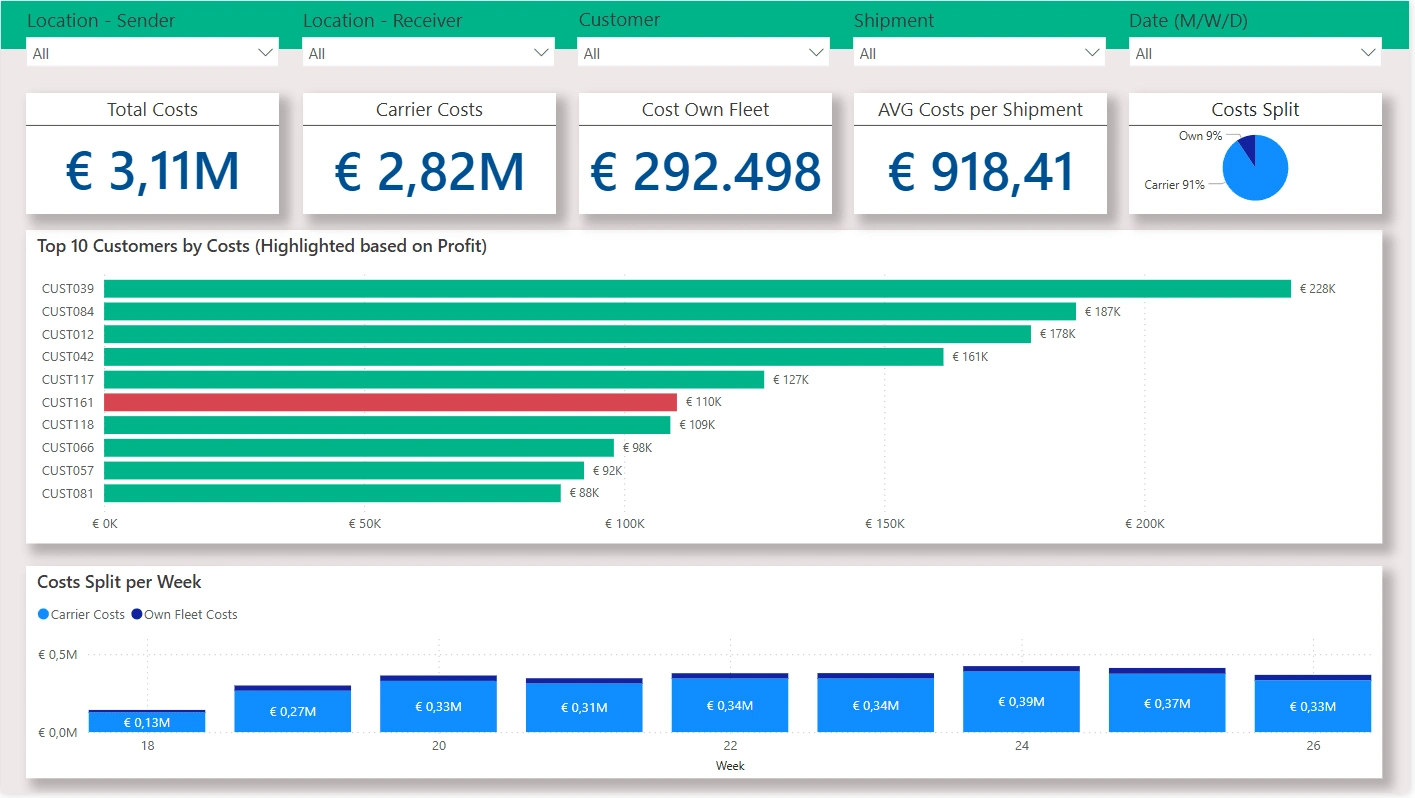
Cost distribution between carrier and own fleet
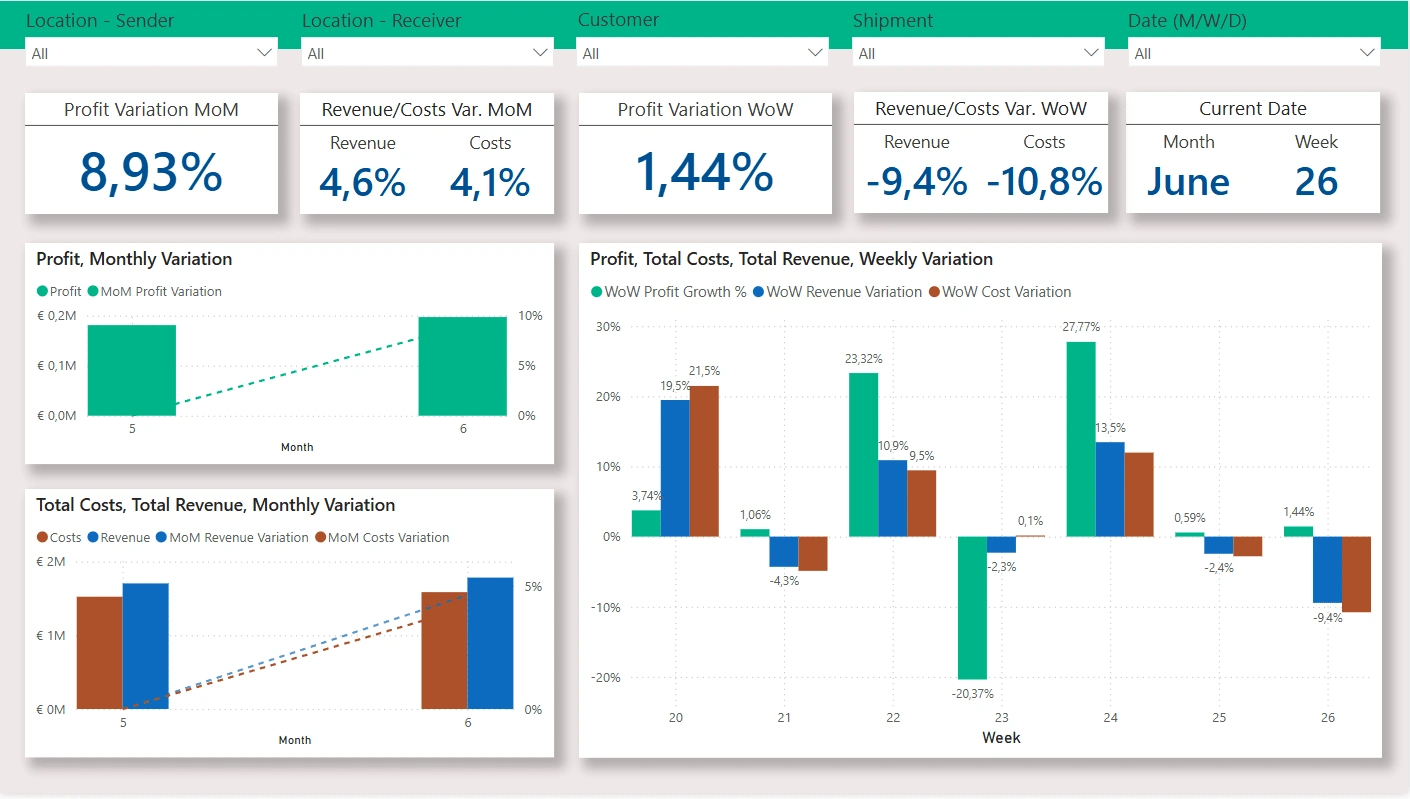
Week-over-week and month-over-month profitability trends
However, the raw dataset had:
Incorrect cost carrier values (inflated by decimal issues)
Inconsistent data types and formatting
Shipment IDs that were not unique
No clear way to analyze by route or customer nationality
My Solution:
1. Data Understanding & Cleanup
Loaded the dataset in Python for initial EDA and data quality checks
Identified Cost Carrier discrepancies and recalculated using:
Revenue - Gross Profit - Cost ContractorCleaned and trimmed text fields in Power Query
Created an
Is_International column for domestic vs international route analysis2. Dimensional Model in Power BI
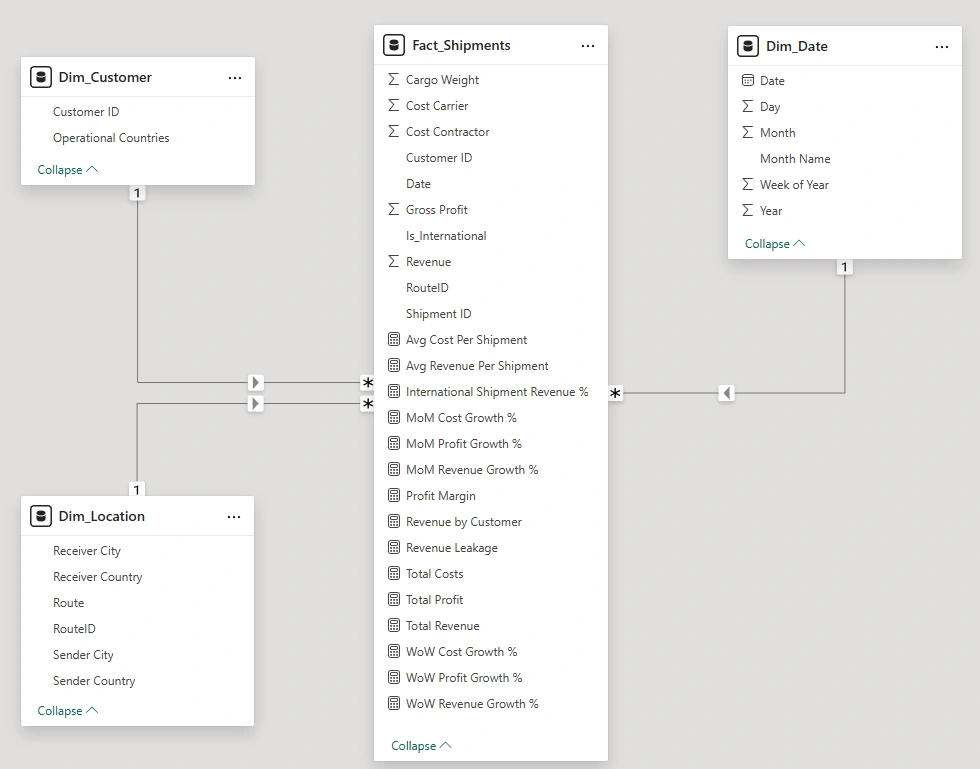
Built a star schema for clarity and performance:
Fact_ShipmentsDim_Customer with merged countries where the customer operatesDim_Location with a surrogate RouteID combining sender and receiver infoDim_Date for time intelligenceEstablished proper relationships and cardinality
3. Business Logic in DAX
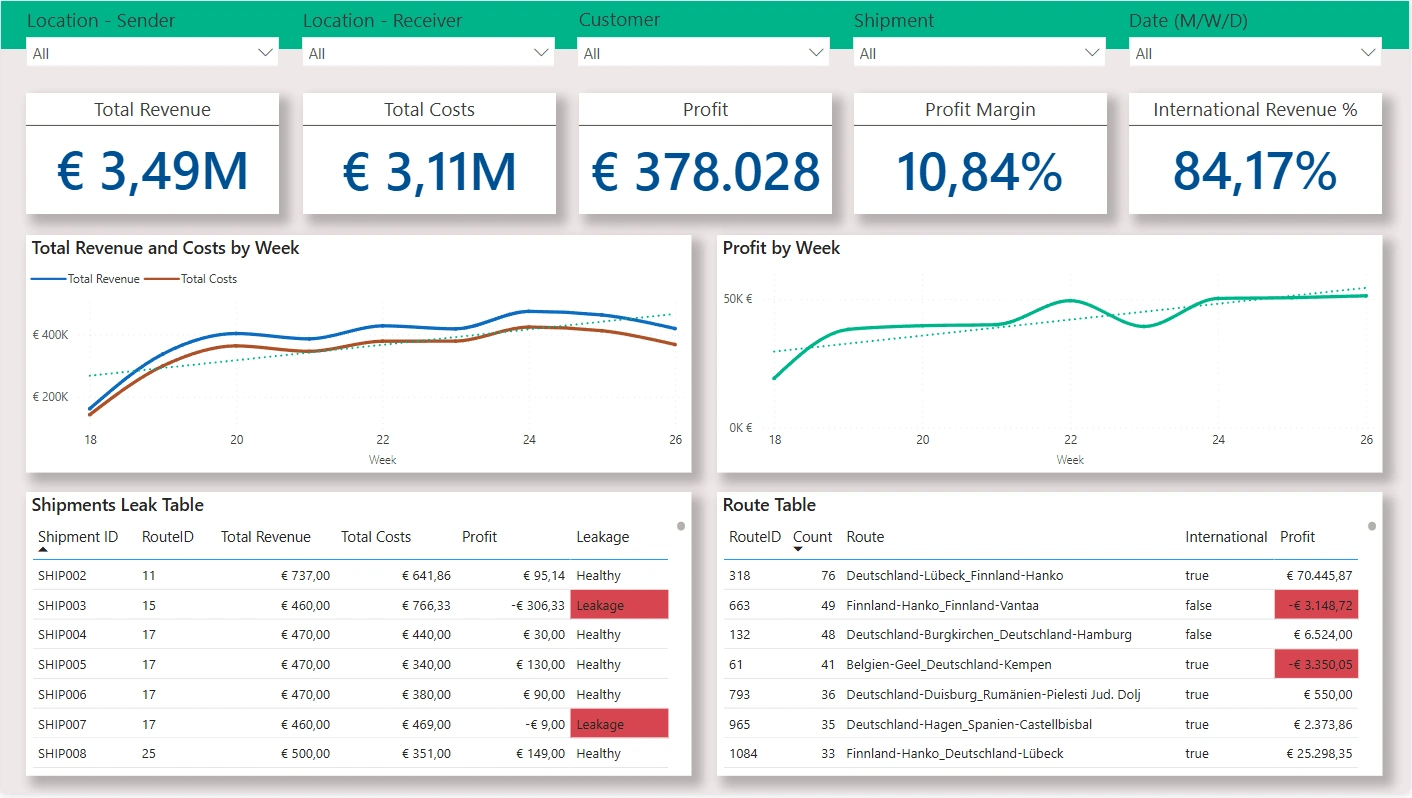
Built key KPIs:
Total Revenue, Costs, Profit, Profit Margin
% International Revenue
Week-over-week & Month-over-month growth metrics
Highlighted low-profit or loss-making shipments with a Leakage Status field
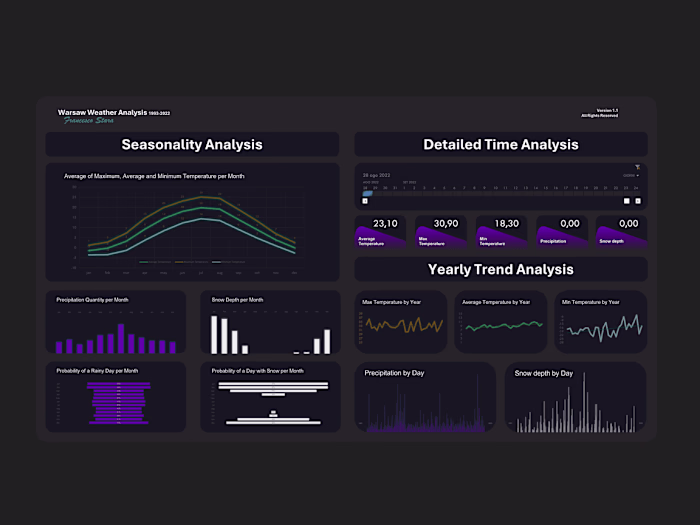
4. Advanced Visualizations
Designed intuitive dashboard pages with slicers and cards
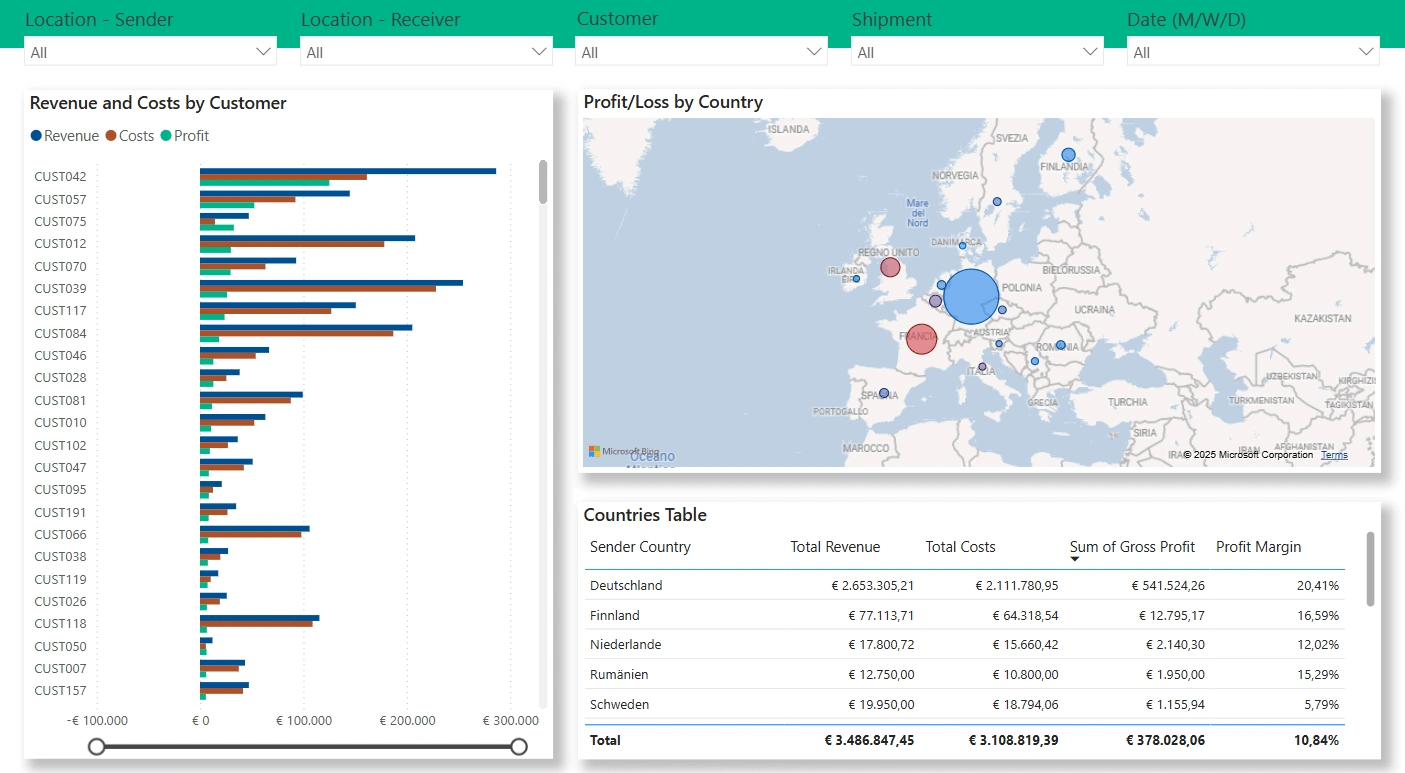
Created a dynamic bubble map to show Profit, Revenue, and Cost by Sender Country
Used bookmarks and buttons to switch between metrics
Applied conditional formatting with thoughtful color gradients
Profit: red-white-green centered at 0
Revenue: blue scale
Costs: red scale
Included breakdowns by customer, route, and international status
Key Insights Delivered:
84% of revenue came from international shipments
One single route contributed over 18% of total revenue
Several routes and customers were operating at a loss
Carrier services made up 91% of cost base — highlighting optimization potential
Result: The final dashboard gave the client a detailed view of cost structures and performance drivers. It empowered the operations team to spot loss-making routes, optimize fleet usage, and improve profitability — all through a clear, stakeholder-friendly interface.
Like this project
Posted Mar 29, 2025
Cleaned data, built Power BI model, fixed cost errors, added KPIs & bookmarks to analyze profit, cost & revenue. Uncovered key route & customer issues.
Likes
2
Views
84
Clients
Logistical Company