Professional Power BI dashboard for an English E-Commerce
Francesco Stara
In this e-commerce analysis project, I embarked on a comprehensive examination of online transactional data. Utilizing Python for preliminary exploration, SQL for in-depth investigation, and Power BI for detailed visualization, this work showcases a meticulous blend of data analytics and visual representation.
I first started analyzing the raw data with Python for:
1. Handling missing data
2. Handling cancelled transactions
3. Handling outliers
Loading this content connects you to drive.google.com.
drive.google.com privacy informationWith the SQL I wanted to provide the client a good toolbox of queries that can be used for future analysis.
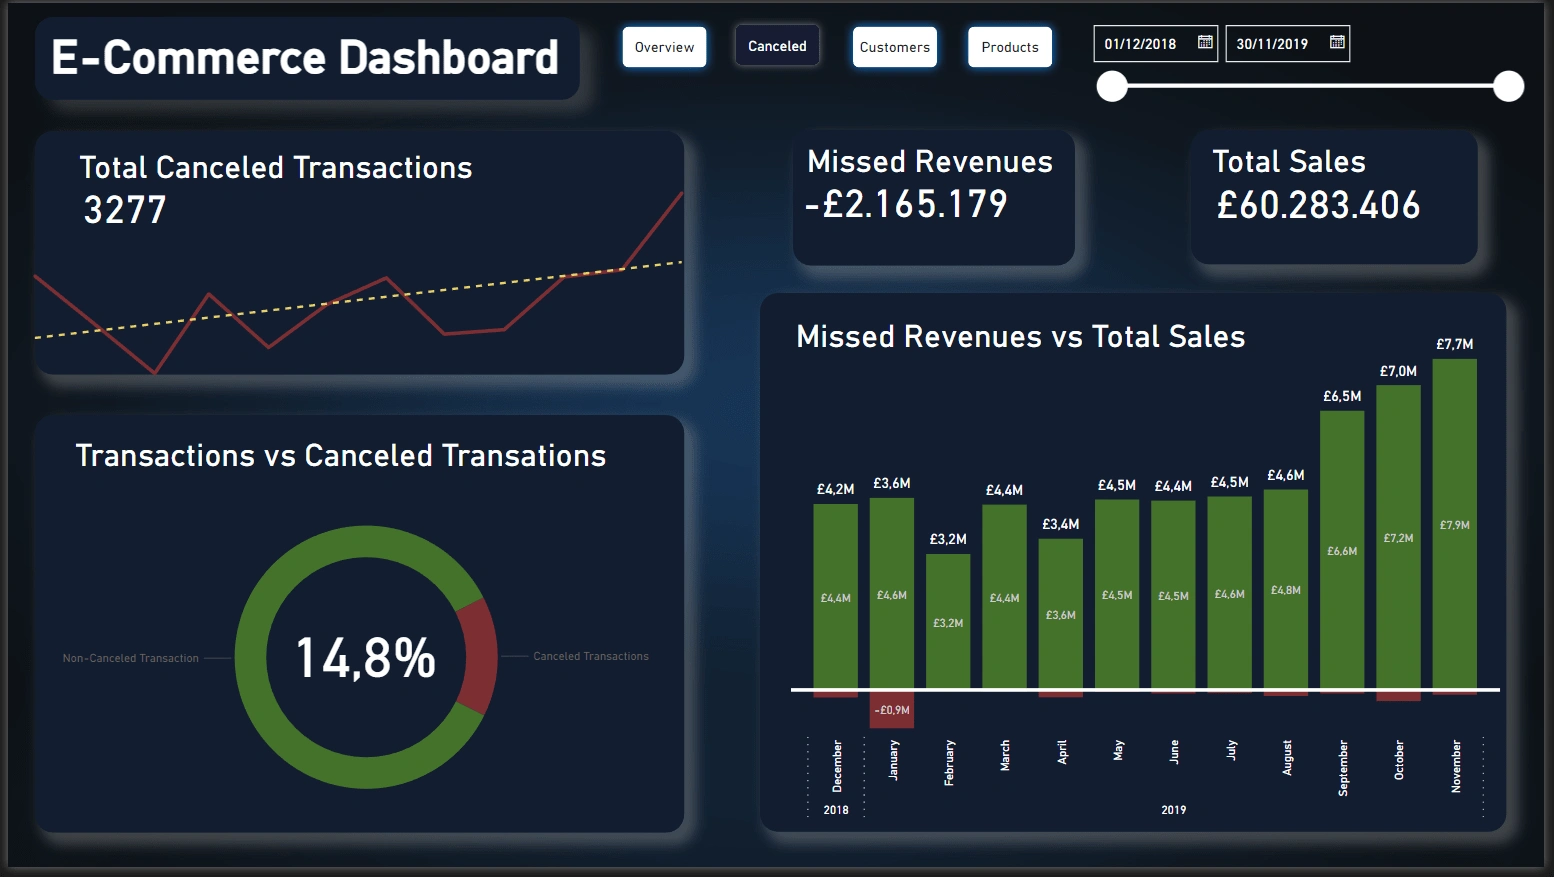
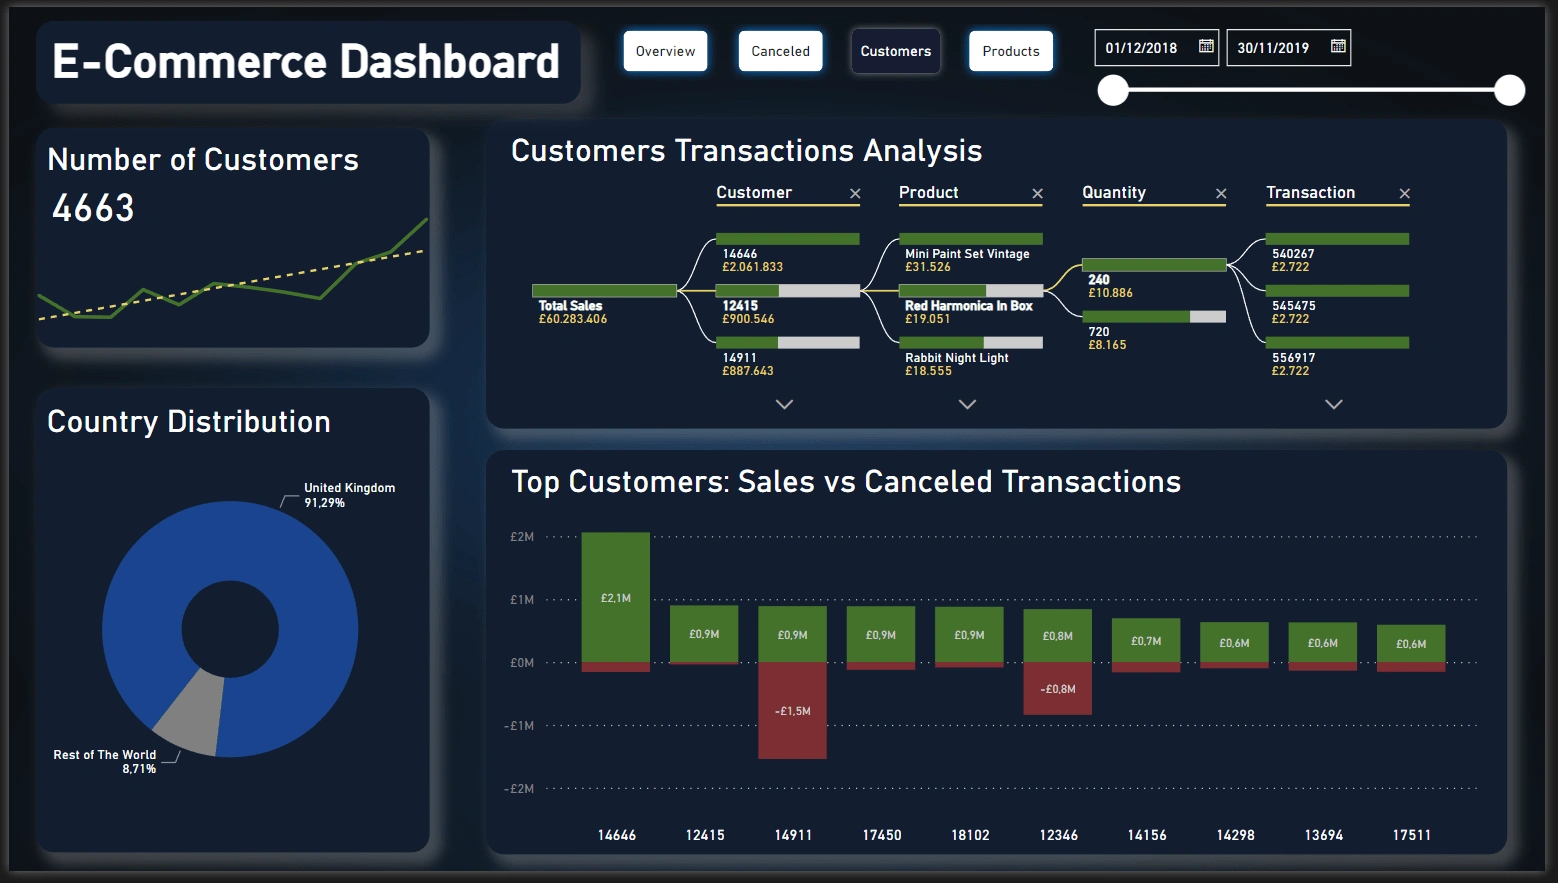
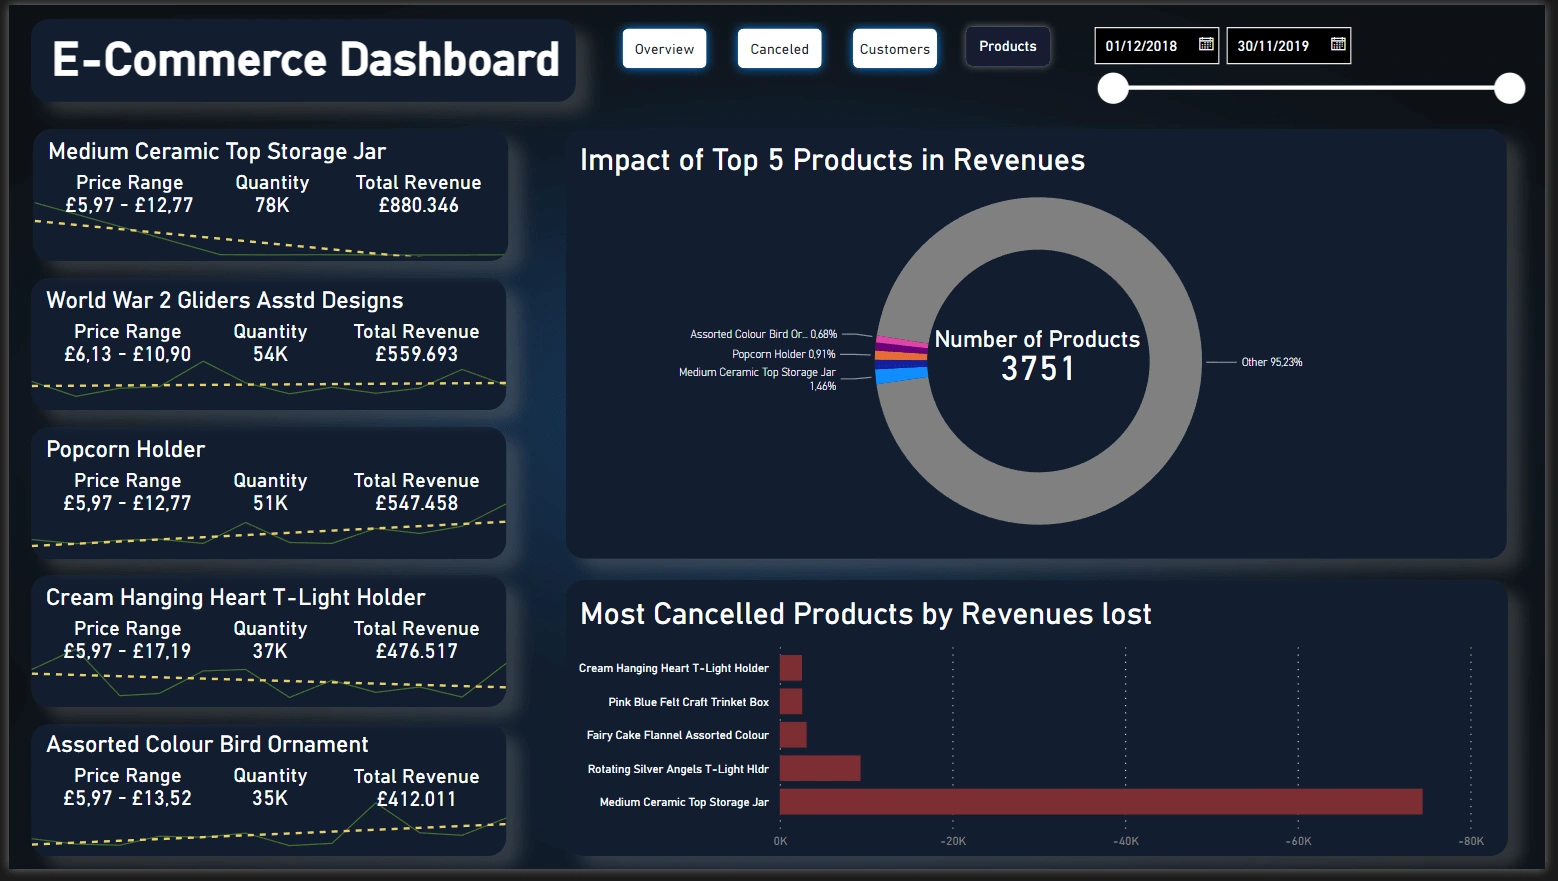
My goal is to inspect sales trends, discover high-performing products, learn about customer segmentation, and uncover trends in canceled transactions.
Some of the key issues to be addressed include: How have sales trends changed over the months? Which products are frequently purchased? How do cancellations impact overall sales?
Loading this content connects you to drive.google.com.
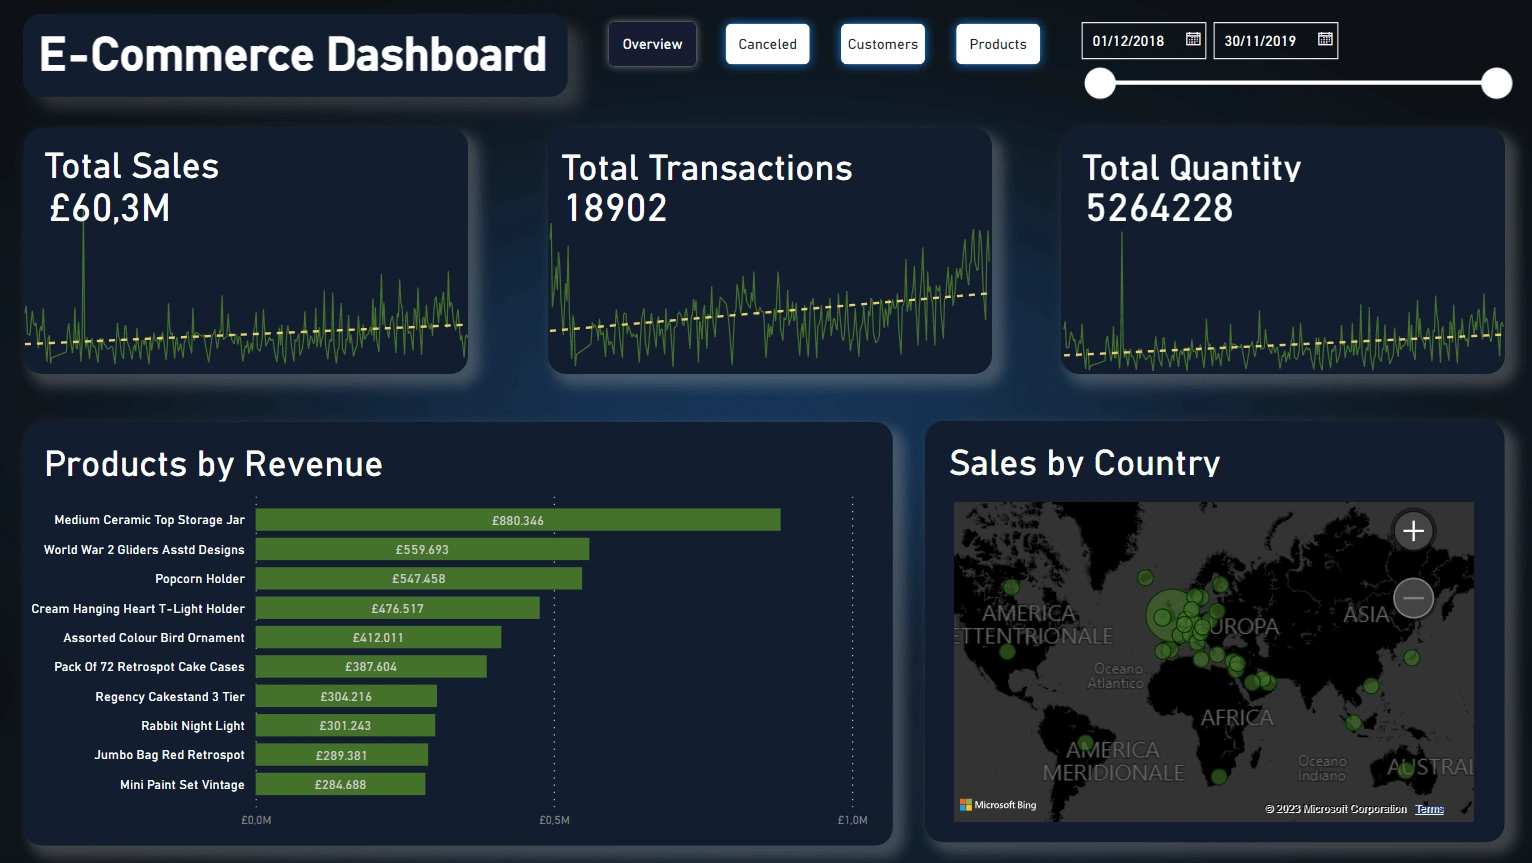
drive.google.com privacy informationAs requested by the client I created a dashboard to transform analytical findings into intuitive and informative visuals, aiding in better data interpretation. What to expect?
Sales Trajectory: I showed the sales trends over time, offering a panoramic view of business performance.
Top-Performing Products: Visualization tools highlighted the products driving a good number of sales.
Customer Segmentation: Visual tools allowed for an in-depth comparison of regular versus occasional shoppers.
Like this project
Posted Feb 24, 2024
This report presents a comprehensive study of a year's worth of e-commerce transactions, highlighting the patterns discovered.