Data Visualization for Findymail
Diana Fabianczuk
In my LinkedIn post, I discuss the Findymail case and my approach to work—read it via the link: Linkedin post
About the project
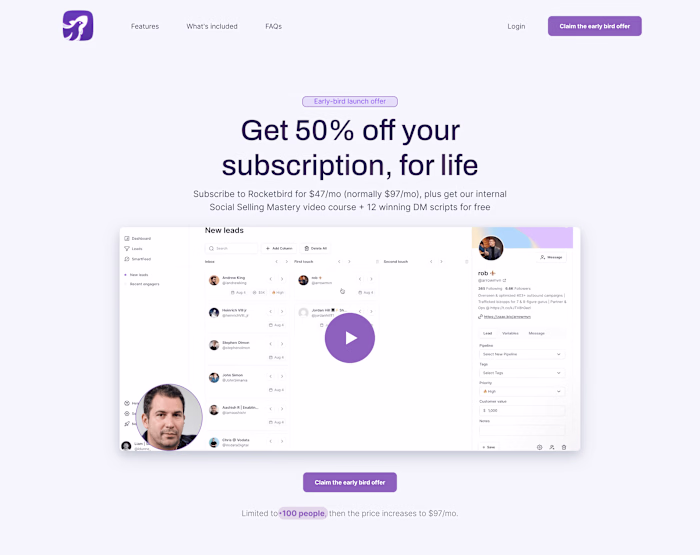
Findymail, a SaaS company, engaged me to transform their outdated tables into modern, highly legible data tables, enhancing readability, visual appeal, and overall user experience.
Solution
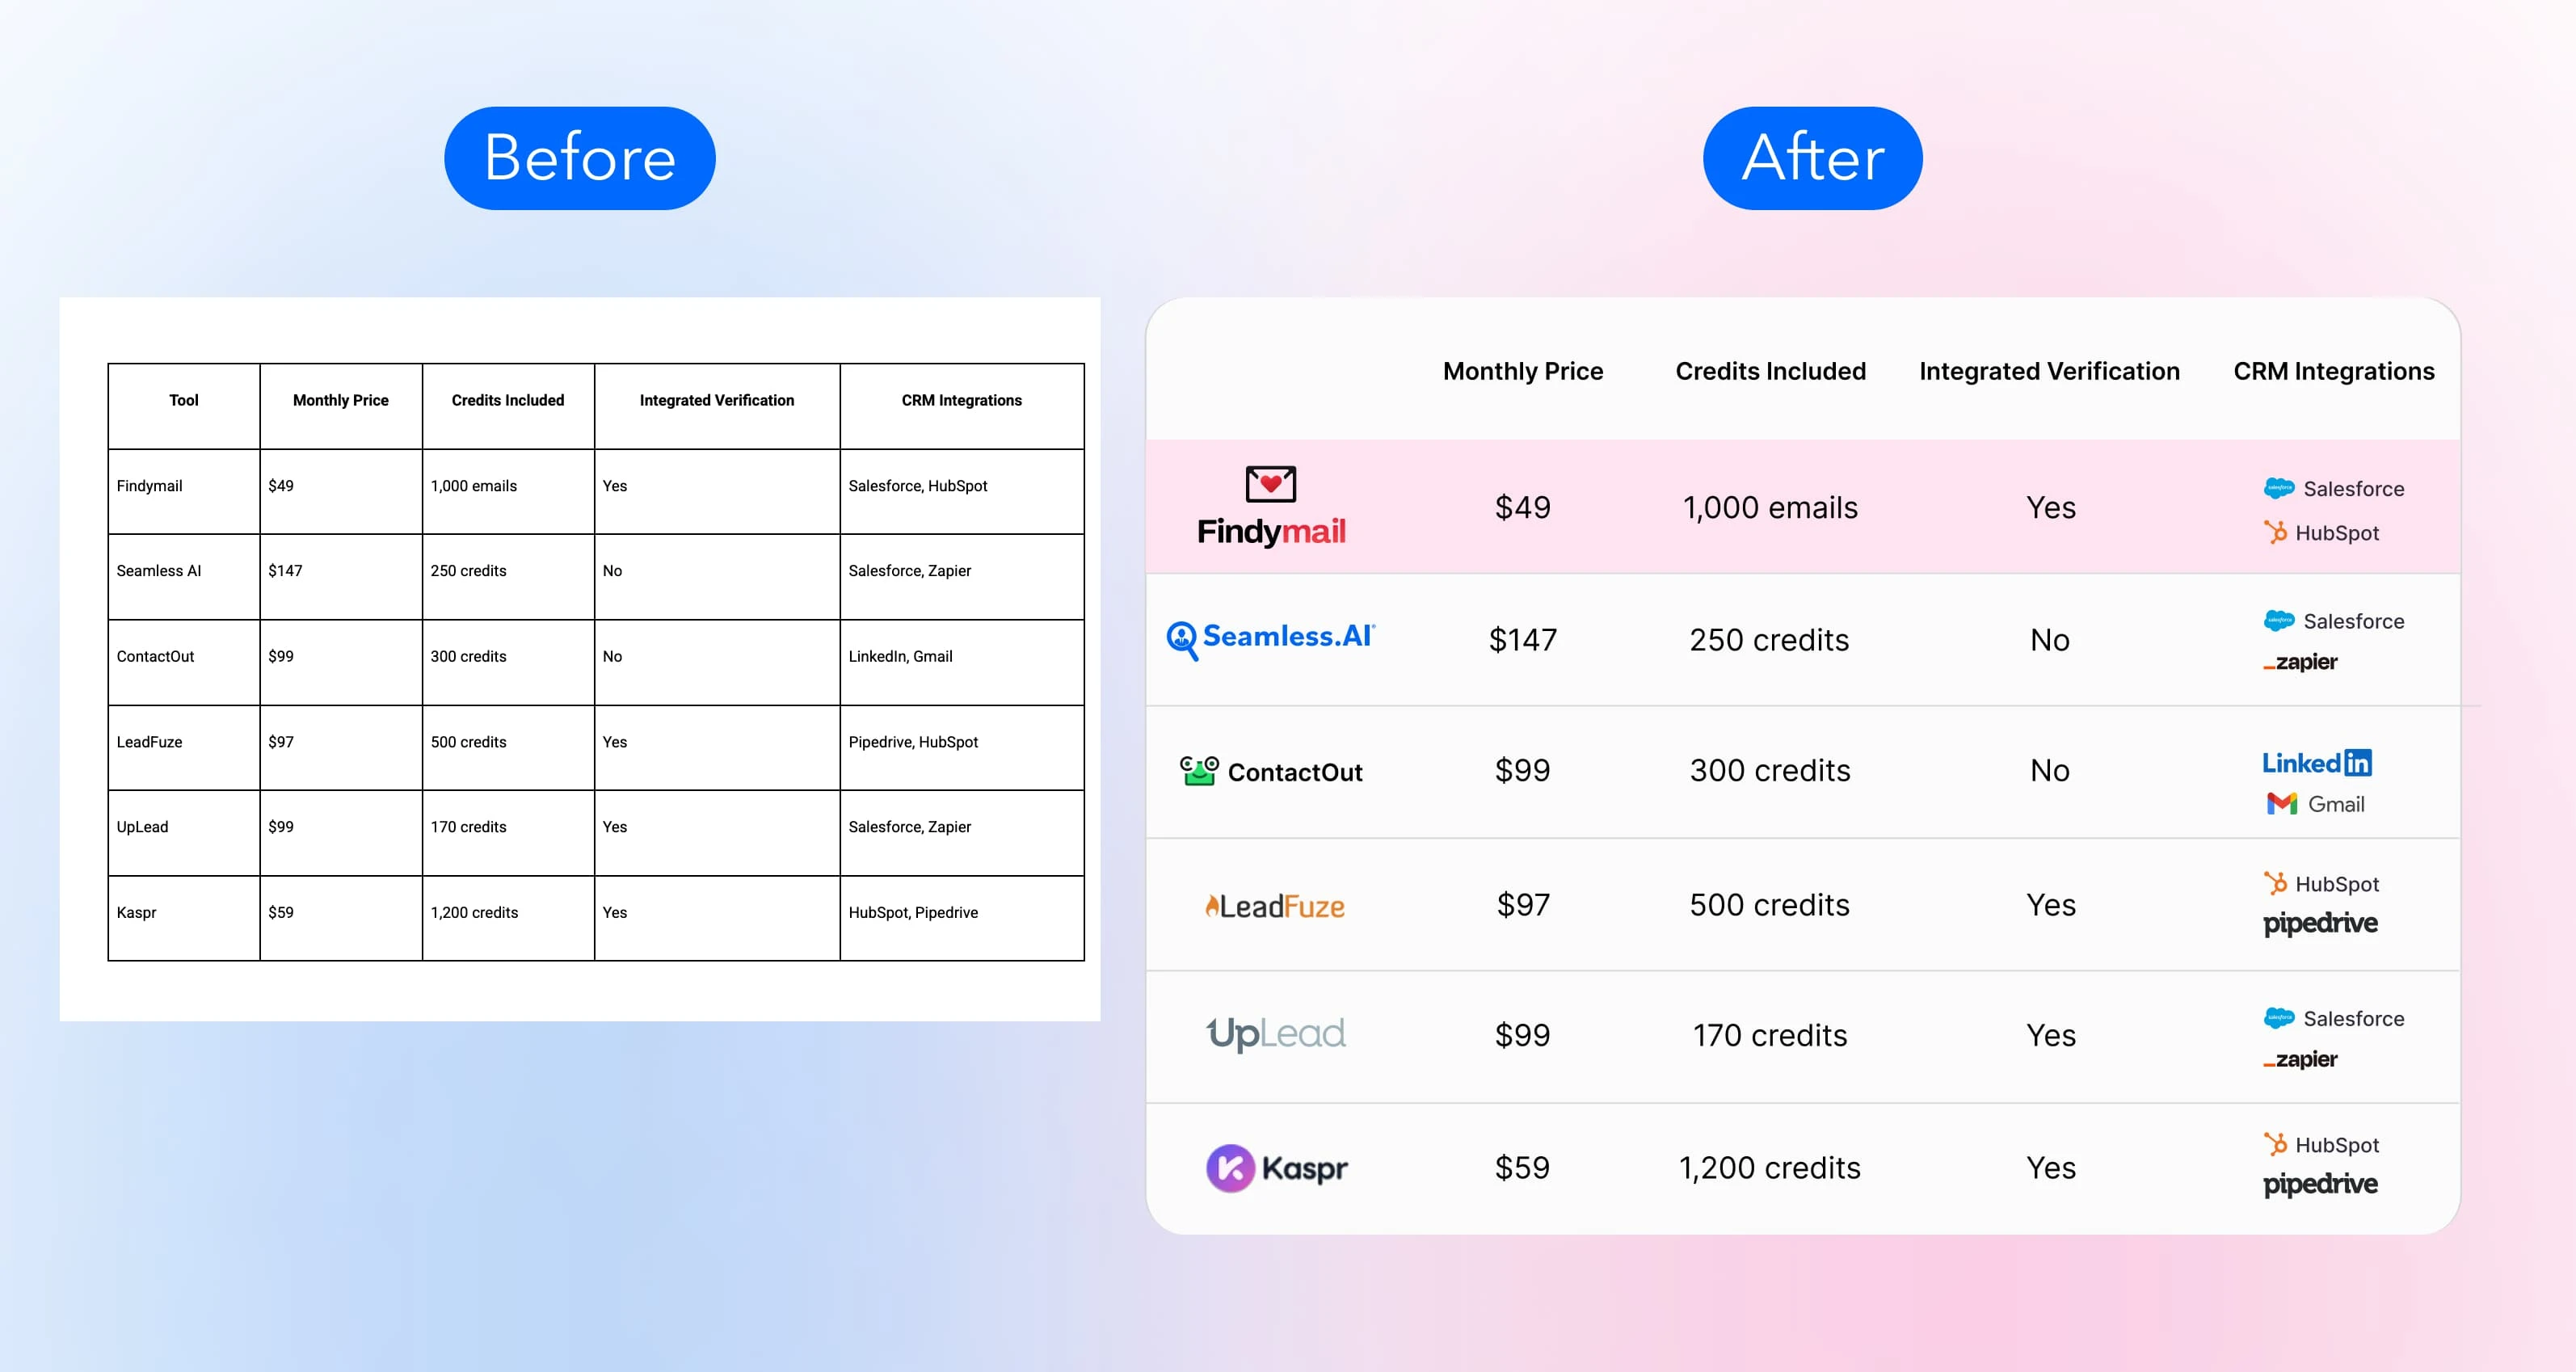
Findymail needed their comparison tables redesigned — the existing ones were dense, hard to scan, and losing readers before they reached the CTA.
Data Visualization & UX Optimization
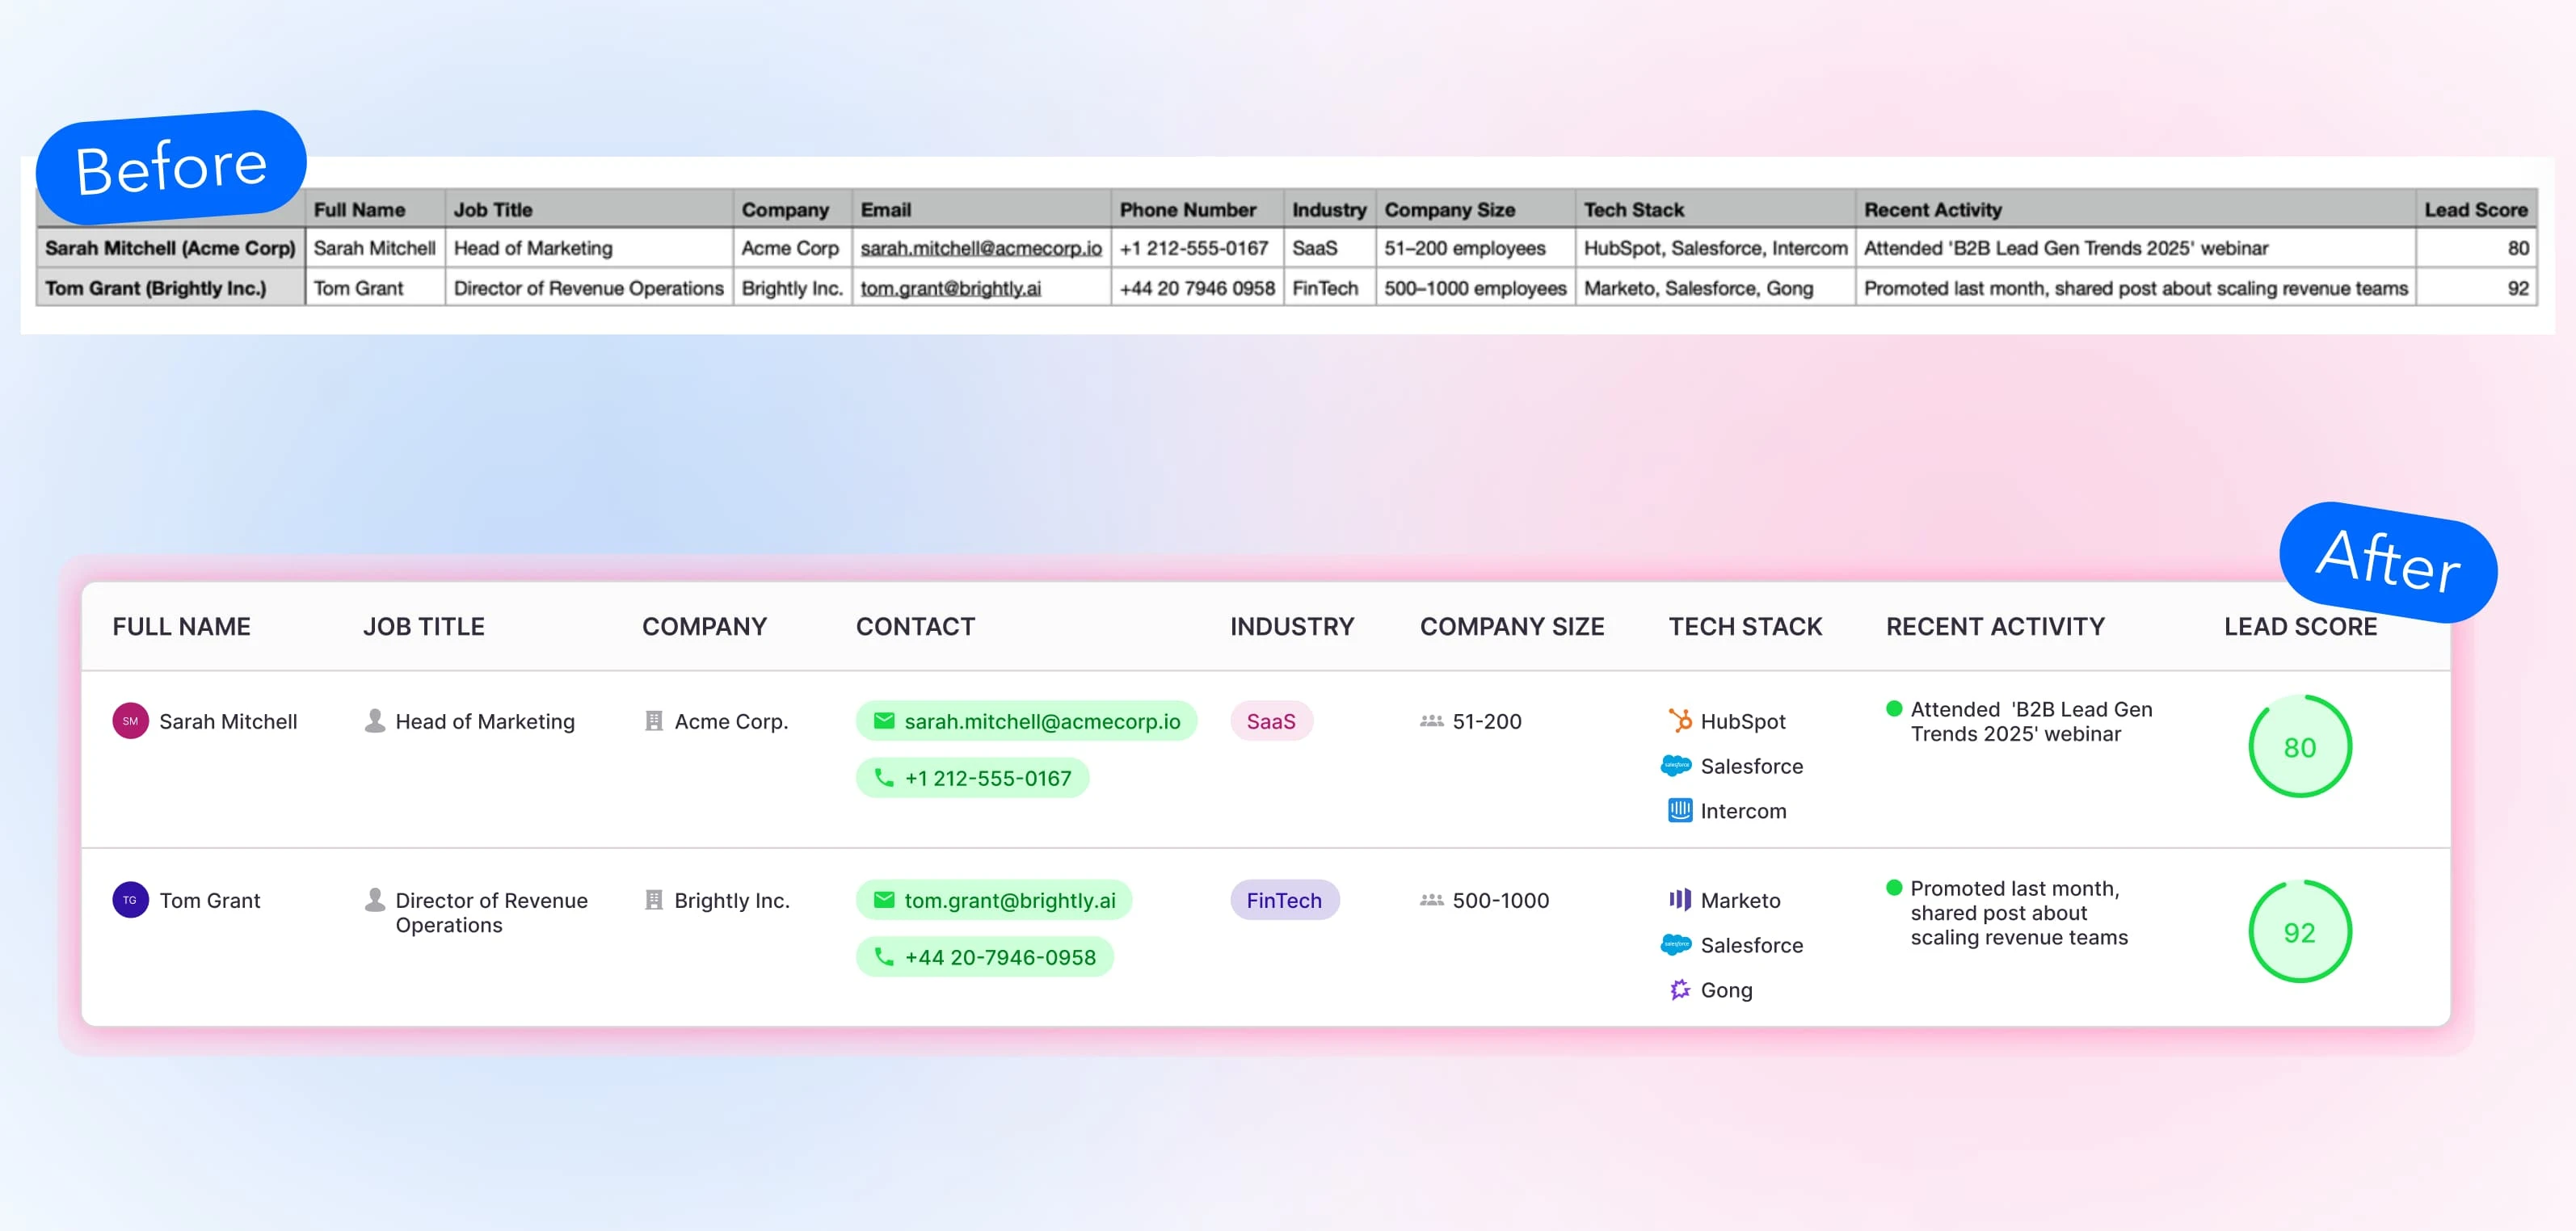
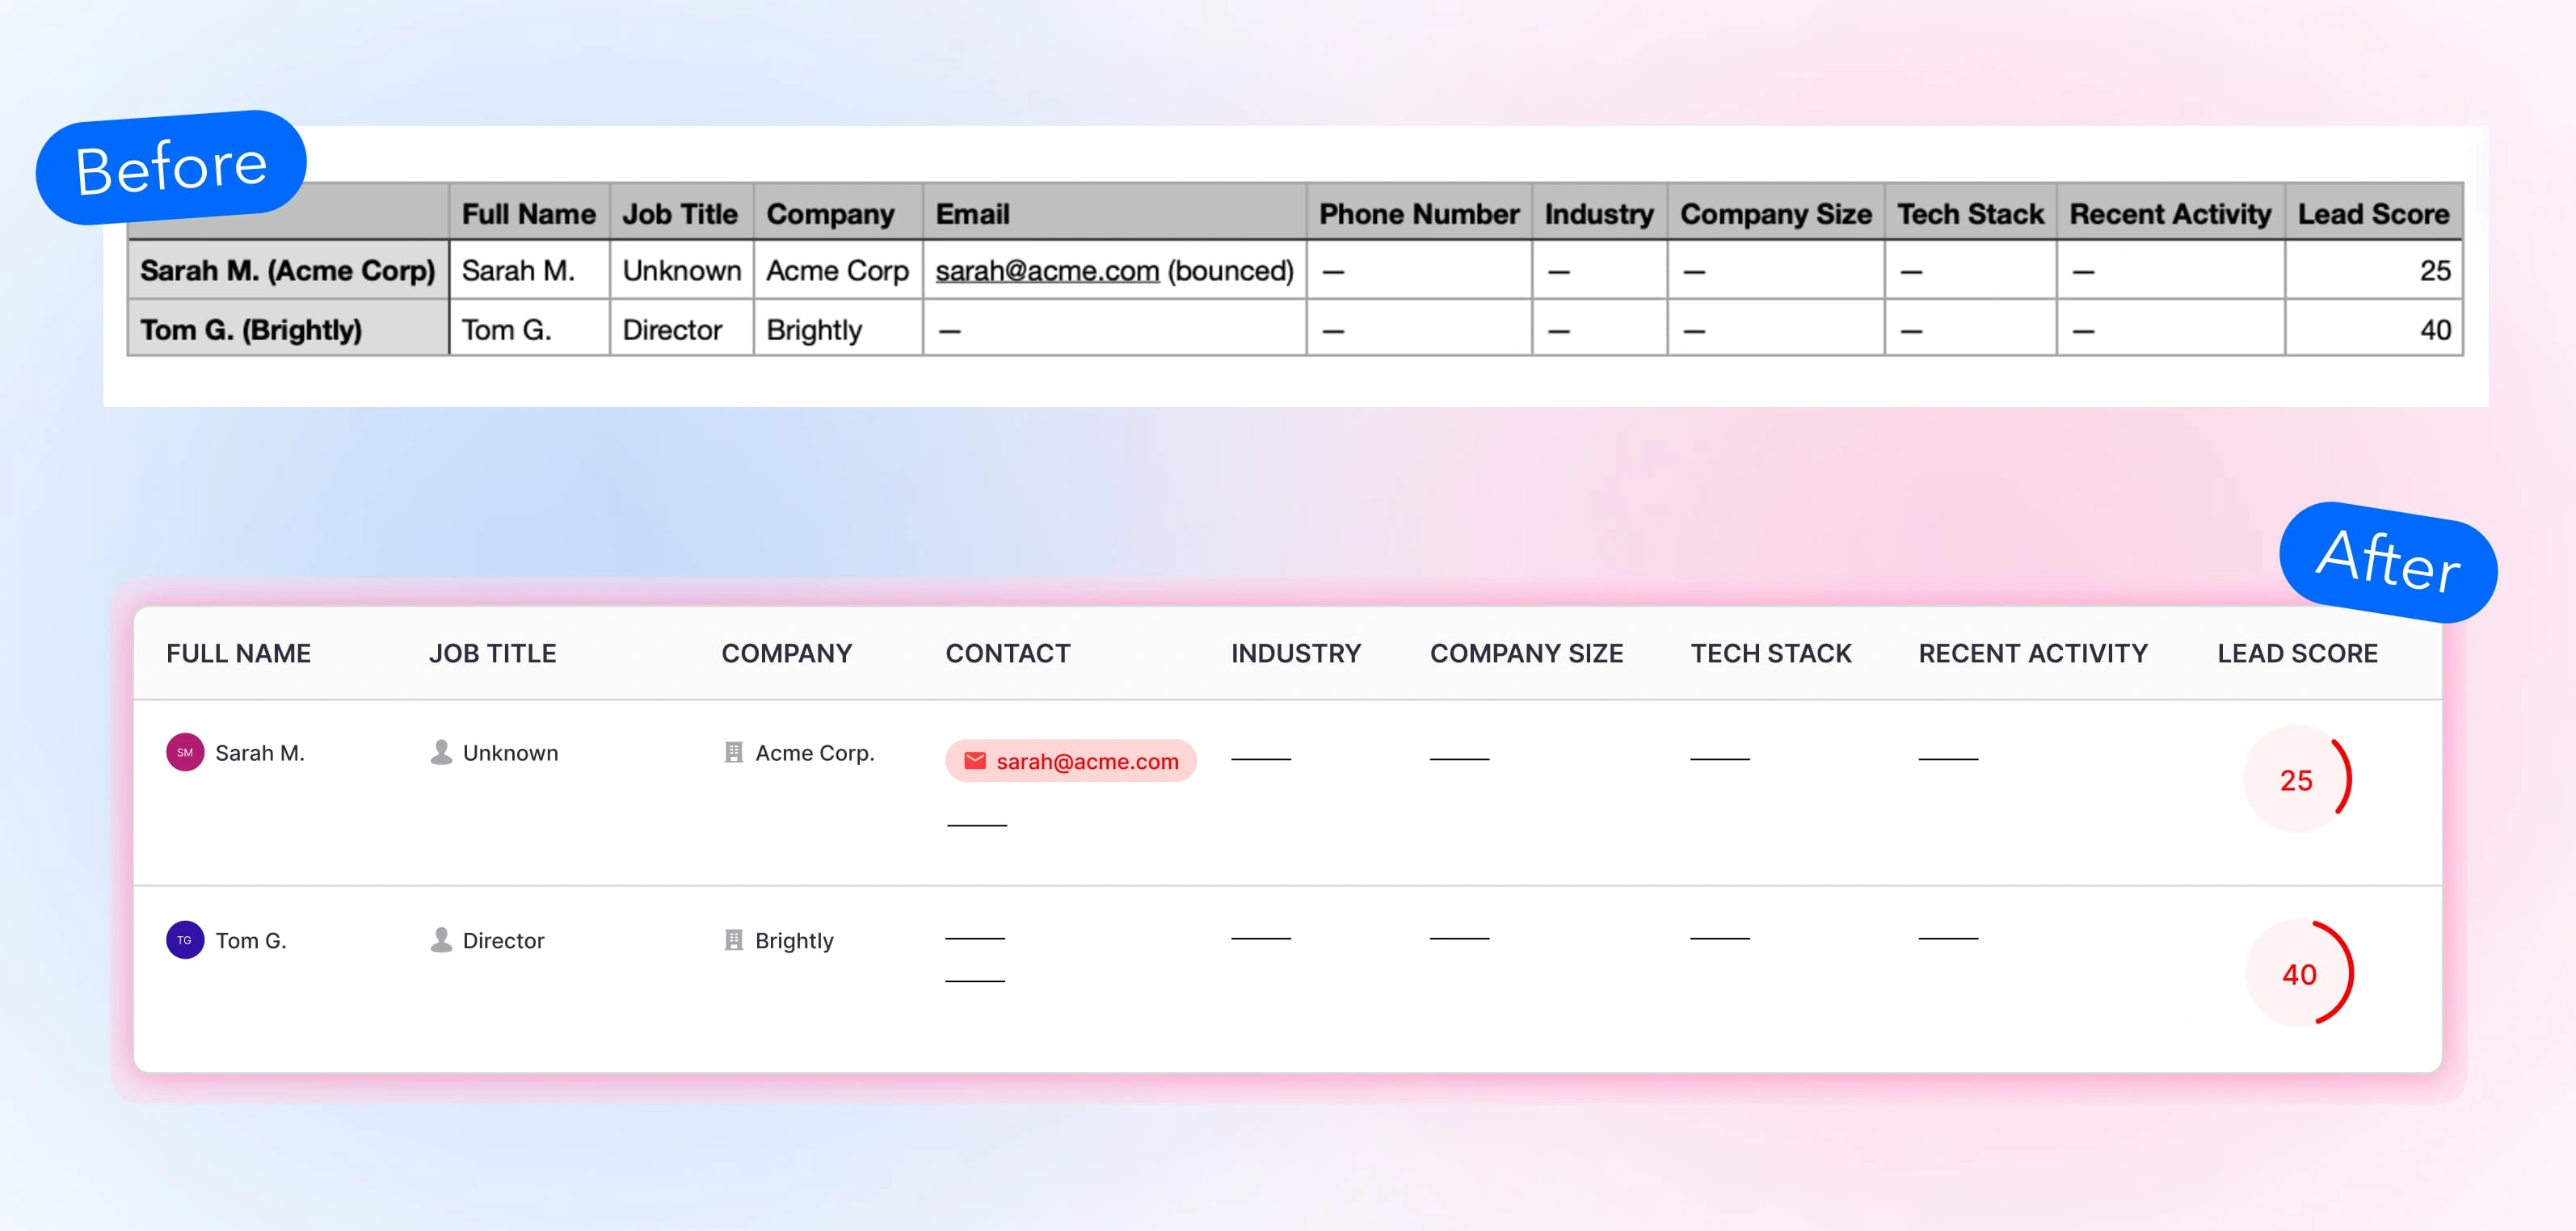
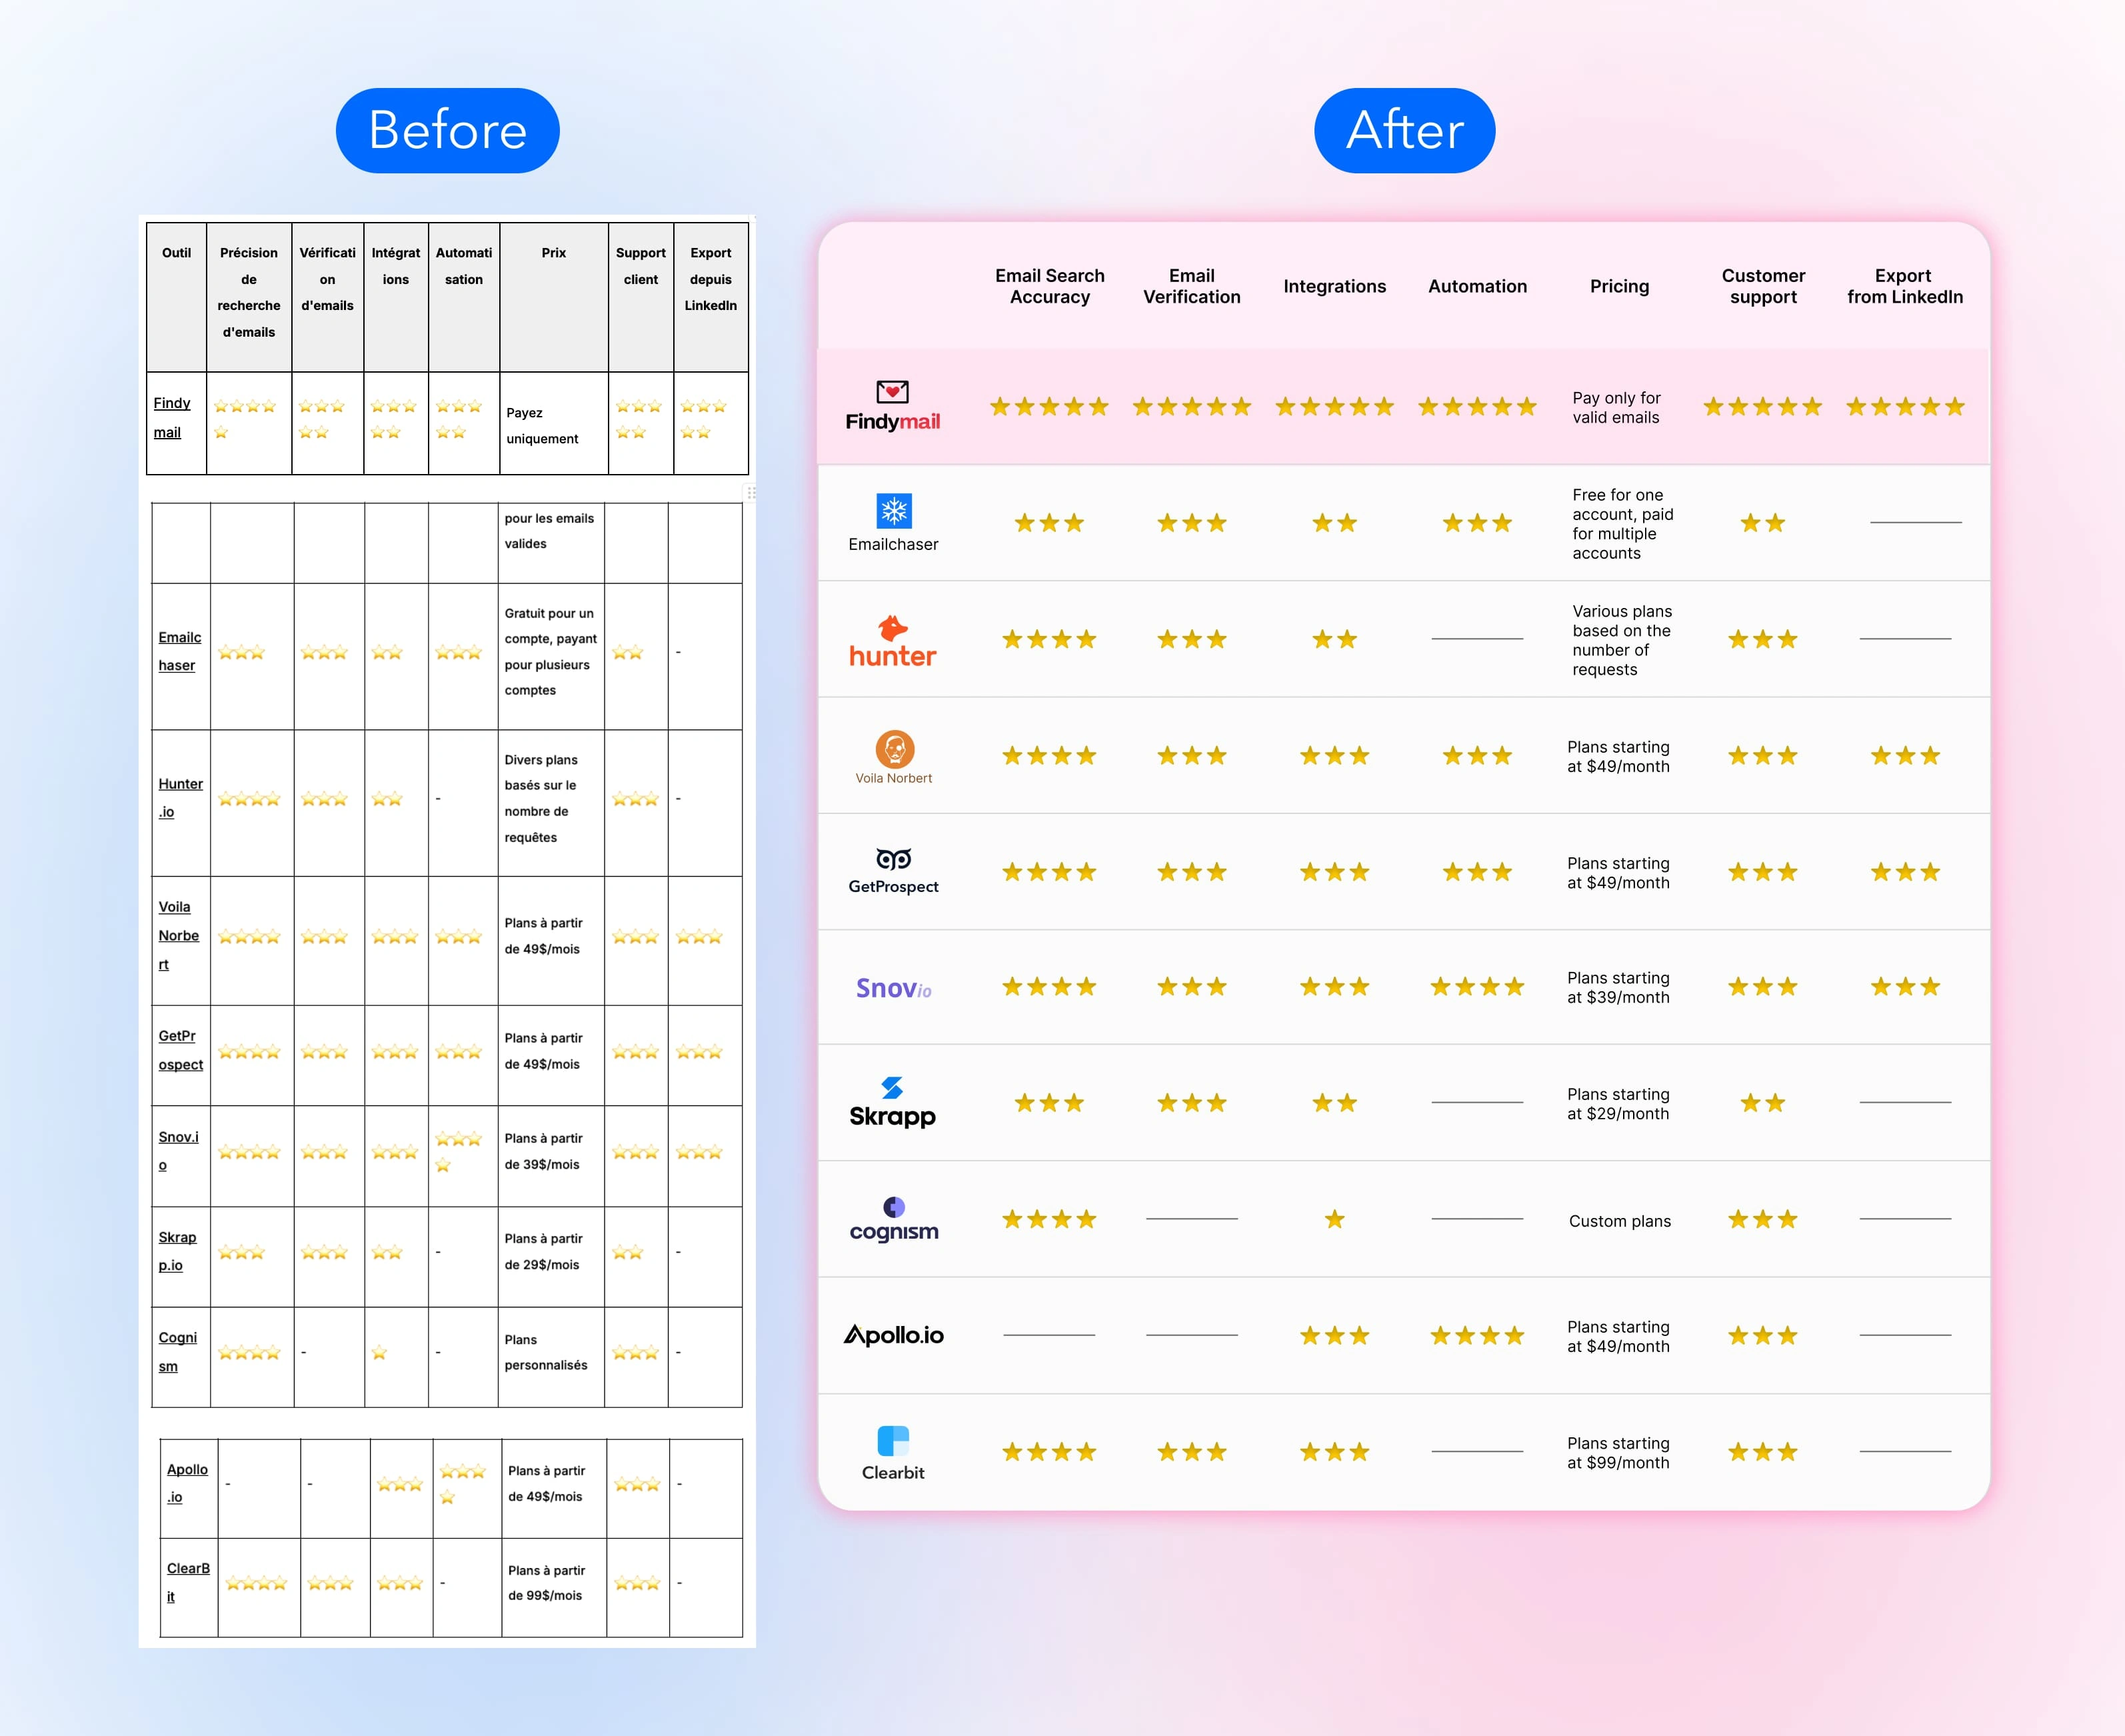
I didn’t just redraw the tables; I conducted a comprehensive data analysis, reorganized the content for optimal information architecture clarity, and eliminated redundancy to enhance the user experience. By creating meaningful connections between related data points and applying a consistent visual hierarchy, I transformed dense SaaS metrics into impactful, conversion-focused tables. Now, users can quickly grasp key insights-no heavy reading required-enhancing both readability and engagement.
before/after

before/after
before/after
before/after

Like this project
Posted May 1, 2025
Elevated Findymail’s information architecture: I analysed and restructured outdated tables, unified related data points, and introduced a bold visual hierarchy.
Likes
2
Views
70
Timeline
Apr 7, 2025 - May 1, 2025