Data Visualization Projects in Sonipat
Data Visualization Projects in Sonipat
Sign Up
Post a job
Sign Up
Log In
Filters
2
Projects
People
Message
0
Rashmi Lakhera
pro
Produced this high-energy promotional video for HestaBit’s GeoVista-AI platform, designed specifically for exhibition at GITEX Global 2025. The video seamlessly blends 3D data visualization, dynamic terrain modeling, and sleek UI motion graphics to communicate complex AI-driven mining solutions. By turning abstract subsurface data into an engaging visual narrative, this piece showcases my ability to craft premium, event-ready product explainers that capture attention and elevate enterprise tech brands.
0
138
Message
0
Somit Guha
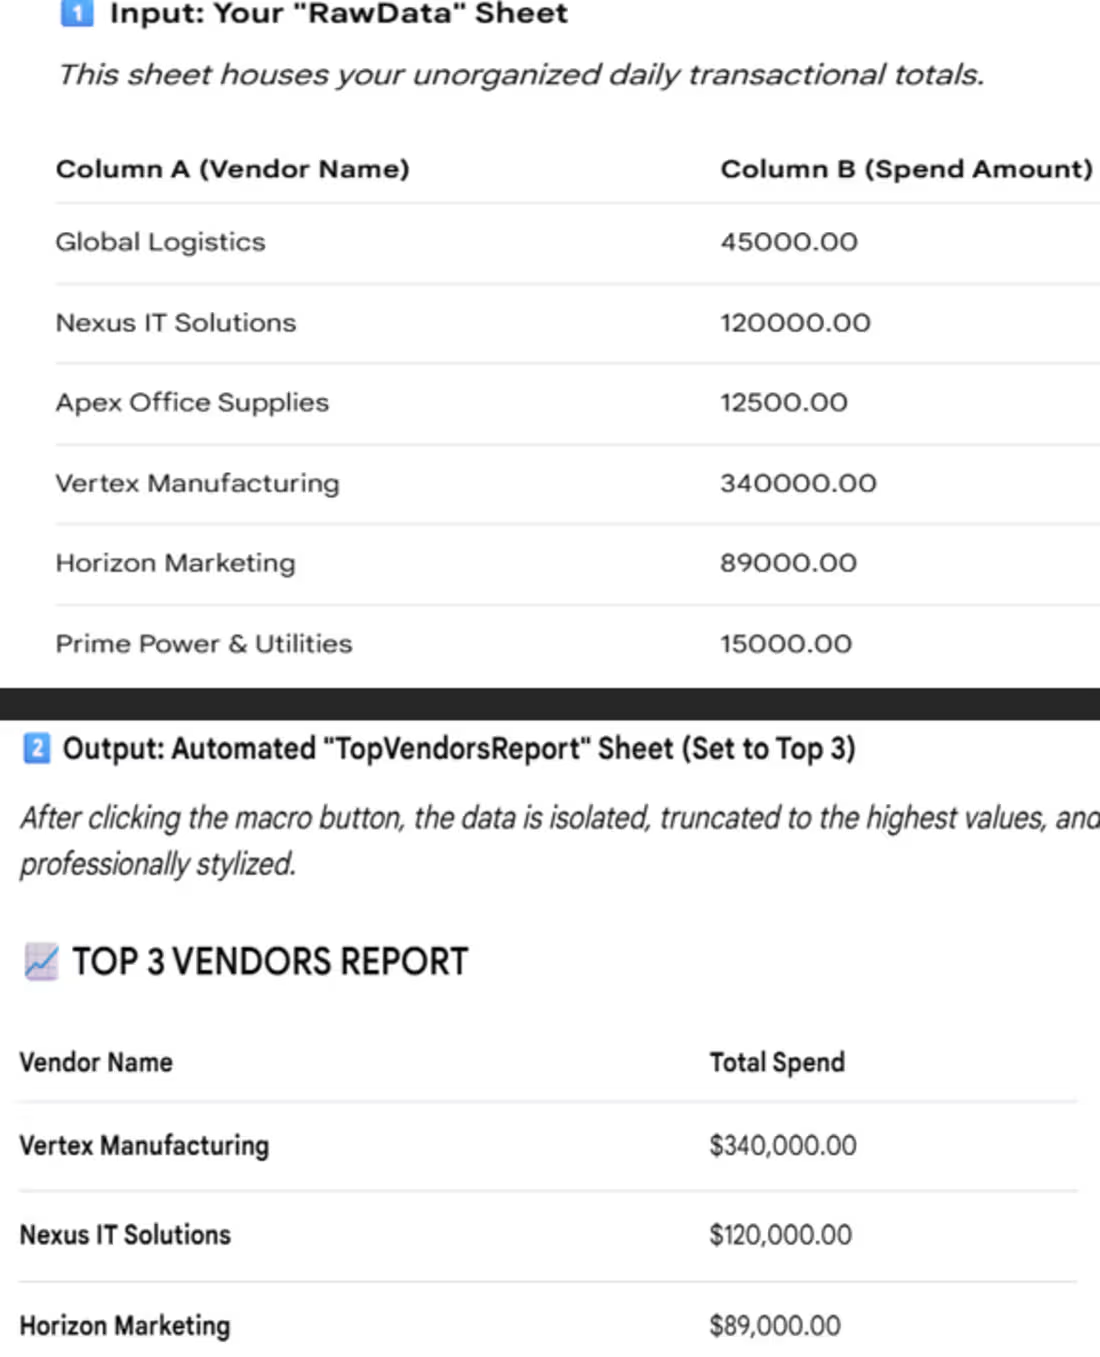
Generating an automated Top Vendors Report using an Excel Macro moves client data through three distinct phases: Extraction, Isolation, and Visual Enhancement. Step 1: Data Replication & Sorting – The macro copies original invoice/spend records into a dedicated reporting sheet to preserve the master data. It then sorts the entire list by total spend in descending order. Step 2: Threshold Trimming – It looks at client data's target (e.g., Top 5 or Top 10) and deletes all rows beneath that cutoff, cleanly removing lower-tier spend data. Step 3: Executive Formatting – It dynamically builds professional headers, applies currency styling ($#,##0.00), colors the table headers for a dashboard feel, and auto-adjusts column widths so text is never cut off. .
1
0
393
Message
1
Chhavi Verma
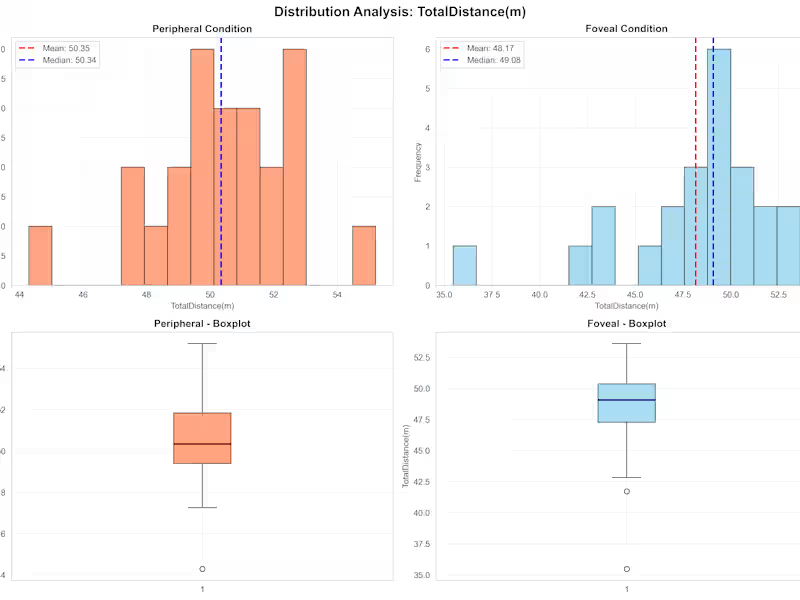
Hi Contra community! Just wrapped a rewarding project for Nauvyashree—delivered deep-dive EDA, custom visualizations, and rich survey sentiment analysis across four datasets. Each milestone included well-designed PDFs packed with clear charts and approachable explanations—making insights accessible for all audiences. I went the extra mile with collaborative Google Meet sessions to walk the client through every analysis, helping connect the findings to big-picture goals. Feedback was fantastic, and milestone-based payments made the process smooth and transparent. This project really strengthened my ability to turn complex results into stories that empower client decision-making. If you want visually engaging, client-focused analytics—or need easy-to-follow reports and hands-on walkthroughs for your next project—let’s connect!
1
139
Message
1
Arya A
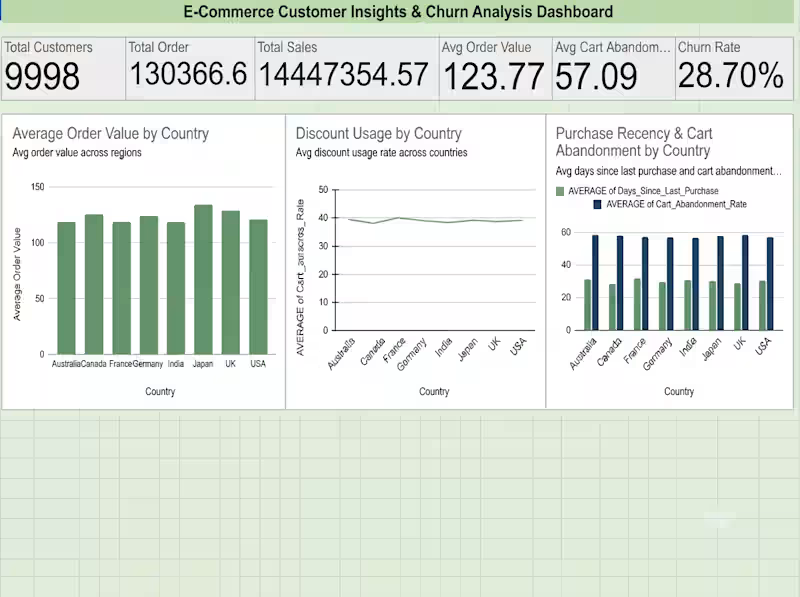
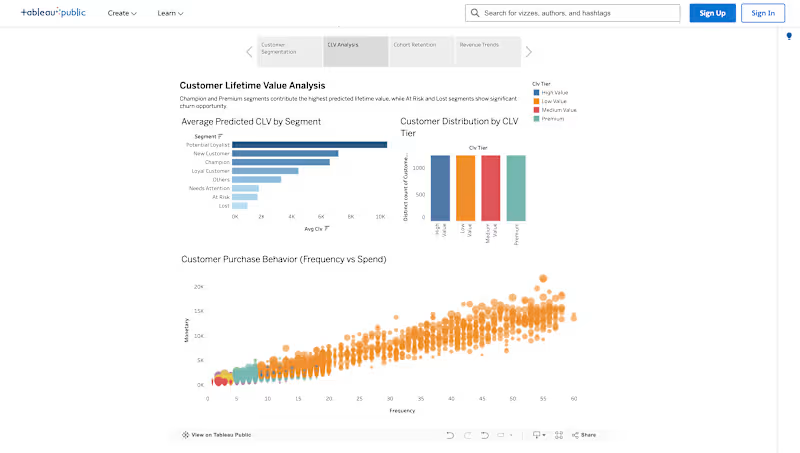
E-Commerce Customer Behavior Analysis Project
1
5
Message
1
Meher Gulati
pro
Dashboard redesign for australian ports company
1
3
Message
1
Vikas Kashyap
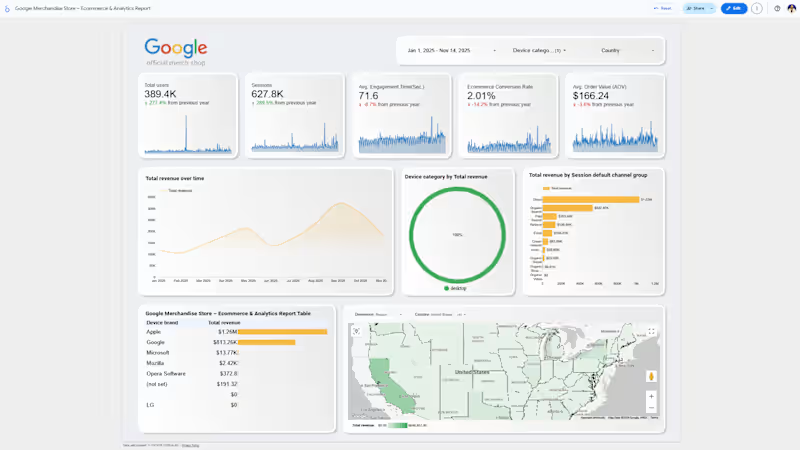
Executive Summary Dashboard for Google Merchandise Store
1
21
Message
1
Saurav Panday
Excel Data Cleaning & Formatting
1
174
Message
0
Urvi Walia
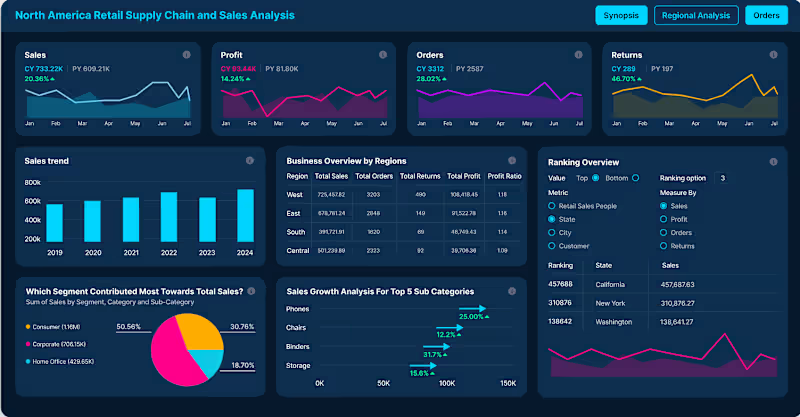
Sales Analysis Dashboard Project Built an interactive Sales Analysis dashboard to track revenue, sales trends, product performance, and customer purchasing behavior. Analyzed sales data to identify growth opportunities and support data-driven business decisions. Key Insights: Identified top-performing products and sales regions Analyzed monthly sales trends and customer buying patterns Tracked KPIs to improve sales performance and forecasting Skills Used: Data Analysis • KPI Reporting • Data Visualization • Dashboard Development • Business Intelligence Tools: Power BI • Excel • SQL • Python
0
32
Message
0
a all
Dynamic Task Tracker
0
58
Message
0
Harsh Mudgal
Dedicated reports with data cleaning and visualization
0
47
Message
0
Shobhit Kumar
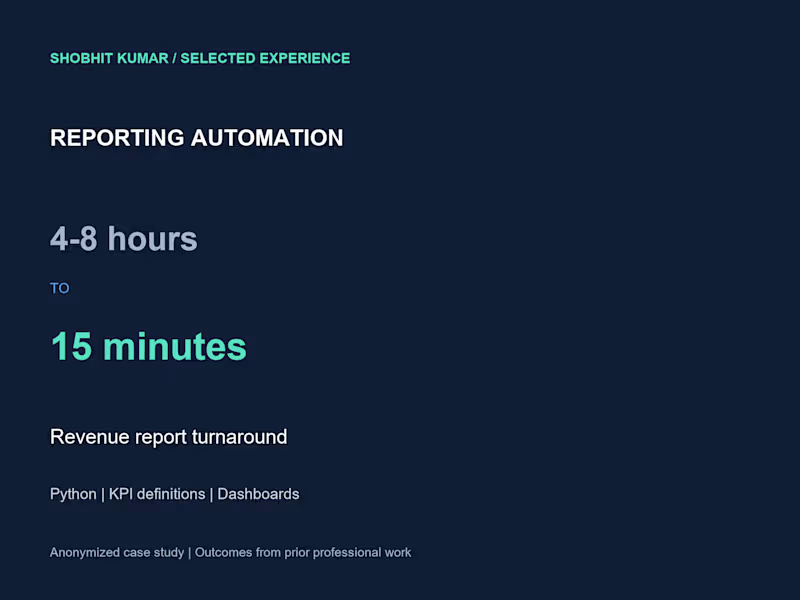
Revenue Reporting Automation: Hours to Minutes
0
0
Message
0
Rahul Gupta
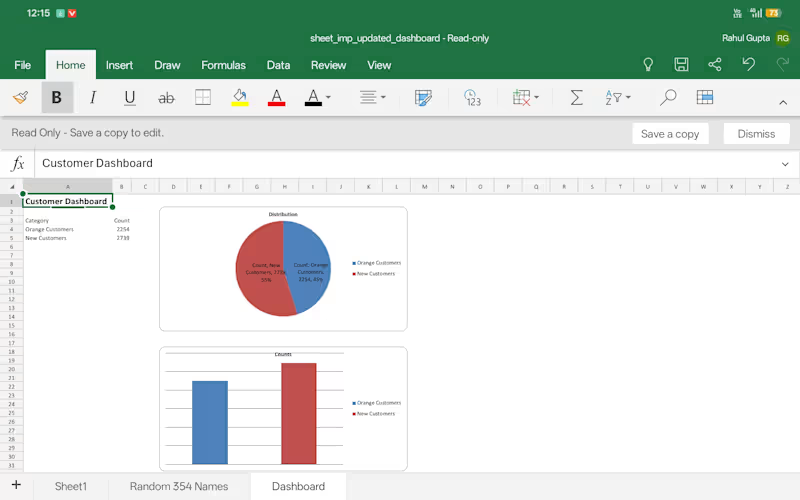
Excel Customer Analytics Dashboard
0
31
Message
0
Himanshu Narwal
Winning space race with data science
0
38
Message
0
Amit Rawat
WeGrow — SaaS Brand Identity & Product Design
0
7
Message
0
mayank
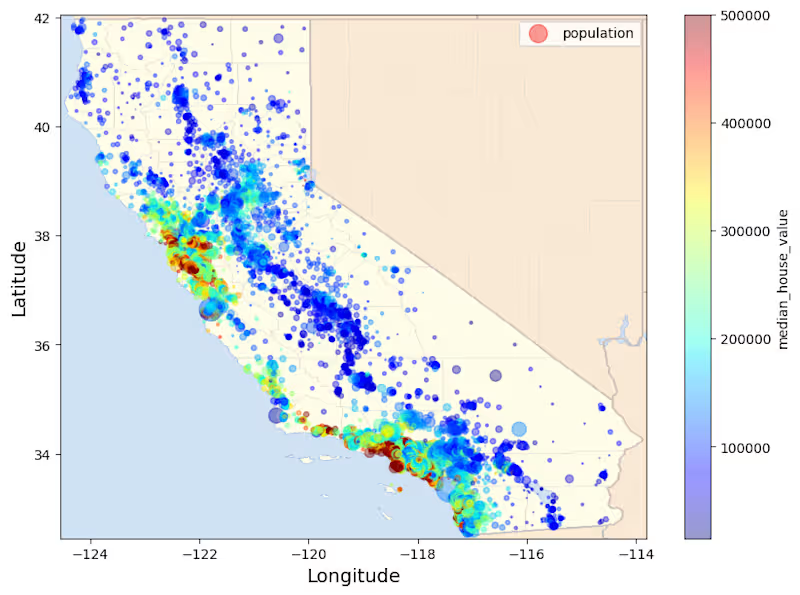
Visualizing and Predicting California Housing Prices: A Linear …
0
104
Message
0
Kuldeep Kumar Yadav
HR Analyst Dashboard Power
0
35
Explore projects