E-Commerce Customer Behavior Analysis Project

Arya A


E-Commerce Customer Behavior Analysis
Project Overview
This project analyzes an e-commerce customer dataset to understand user behavior, engagement patterns, and churn trends. The goal was to clean the data, handle missing values properly, and perform exploratory analysis to identify meaningful business insights.
The dataset was obtained from Kaggle and contains 50,000 customer records with demographic, behavioral, financial, and engagement-related features. The dataset was reduced to 10,000 records for focused analysis.
Objectives
Clean and preprocess the dataset
Handle missing values using logical and data-driven decisions
Analyze customer engagement behavior
Explore churn-related patterns
Understand customer value metrics
Dataset Description
The dataset includes the following categories of variables:-
Demographic Features
Age
Gender
Country
City
Engagement & Activity Metrics
Login_Frequency
Session_Duration_Avg
Pages_Per_Session
Cart_Abandonment_Rate
Wishlist_Items
Email_Open_Rate
Social_Media_Engagement_Score
Mobile_App_Usage
Product_Reviews_Written
Purchase & Financial Metrics
Total_Purchases
Average_Order_Value
Days_Since_Last_Purchase
Discount_Usage_Rate
Returns_Rate
Lifetime_Value
Credit_Balance
Other Features:-
Membership_Years
Customer_Service_Calls
Payment_Method_Diversity
Signup_Quarter
Churned
Data Cleaning & Preprocessing
Column Missing Values Imputation / Cleaning Strategy Business Reasoning
Age 513 Replaced with Median Age is demographic; median prevents distortion from extreme values
Age_Group - Derived Feature Categorised to evaluate churn trends across age segments
Session_Duration_Avg 687 Replaced with Median Likely tracking inconsistencies; median preserves behavioral distribution
Pages_Per_Session 605 Replaced with Median Avoids skew caused by outlier browsing behaviour
Wishlist_Items 786 Replaced with 0 0 represents valid absence of wishlist activity
Total_Purchases 0 Corrected Negative Values; Removed Zero Purchase Rows Negative purchases are invalid; zero purchase users removed for behavioral consistency
Days_Since_Last_Purchase 575 Replaced with Median Missing despite purchase activity indicates logging inconsistency
Discount_Usage_Rate 713 Replaced with 0 0 implies no discount usage behaviour
Returns_Rate 907 Replaced with 0 Missing likely implies no returns recorded
Email_Open_Rate 540 Replaced with Median Email tracking gaps; median maintains distribution
Customer_Service_Calls 33 Replaced with Median Ensures minimal impact on customer support interaction analysis
Product_Reviews_Written 701 Replaced with Median Missing values not necessarily behavioural absence
Social_Media_Engagement_Score 1175 Median + Derived Indicator Created additional column to assess churn sensitivity to engagement
Mobile_App_Usage 997 Dropped Column Highly correlated with Average Order Value = 0 for non-users; low analytical relevance
Payment_Method_Diversity 492 Replaced with Median Prevents distortion in payment behaviour patterns
Credit_Balance 1107 Replaced with 0 0 represents absence of available credit
Several columns contained missing values. Instead of applying a single blanket method, each column was handled based on business meaning.
Session_Duration_Avg – Missing values were likely due to tracking inconsistencies (other engagement metrics were available). Replaced using median imputation to preserve the original behavioral distribution.
Pages_Per_Session – Approximately 605 missing values observed. Replaced using median to avoid skew from extreme browsing behaviour.
Wishlist_Items – Contained valid 0 values representing absence of wishlist activity. Missing values were replaced with 0 to maintain behavioral consistency.
Social_Media_Engagement_Score – 1175 missing values identified. Replaced using median imputation. Additionally, a derived indicator column was created to evaluate the impact of social media engagement on churn behaviour.
Mobile_App_Usage – 997 missing values observed. Due to its strong association with zero Average_Order_Value among non-users and limited analytical relevance, the column was dropped from further analysis.
Credit_Balance – 1107 missing values present. Replaced missing values with 0, assuming absence of available credit.
Days_Since_Last_Purchase – Missing values occurred despite recorded purchase activity. Treated as data inconsistency and replaced using median.
Email_Open_Rate – 540 missing values identified. Replaced using median to address potential email tracking gaps.
Exploratory Data Analysis (EDA)
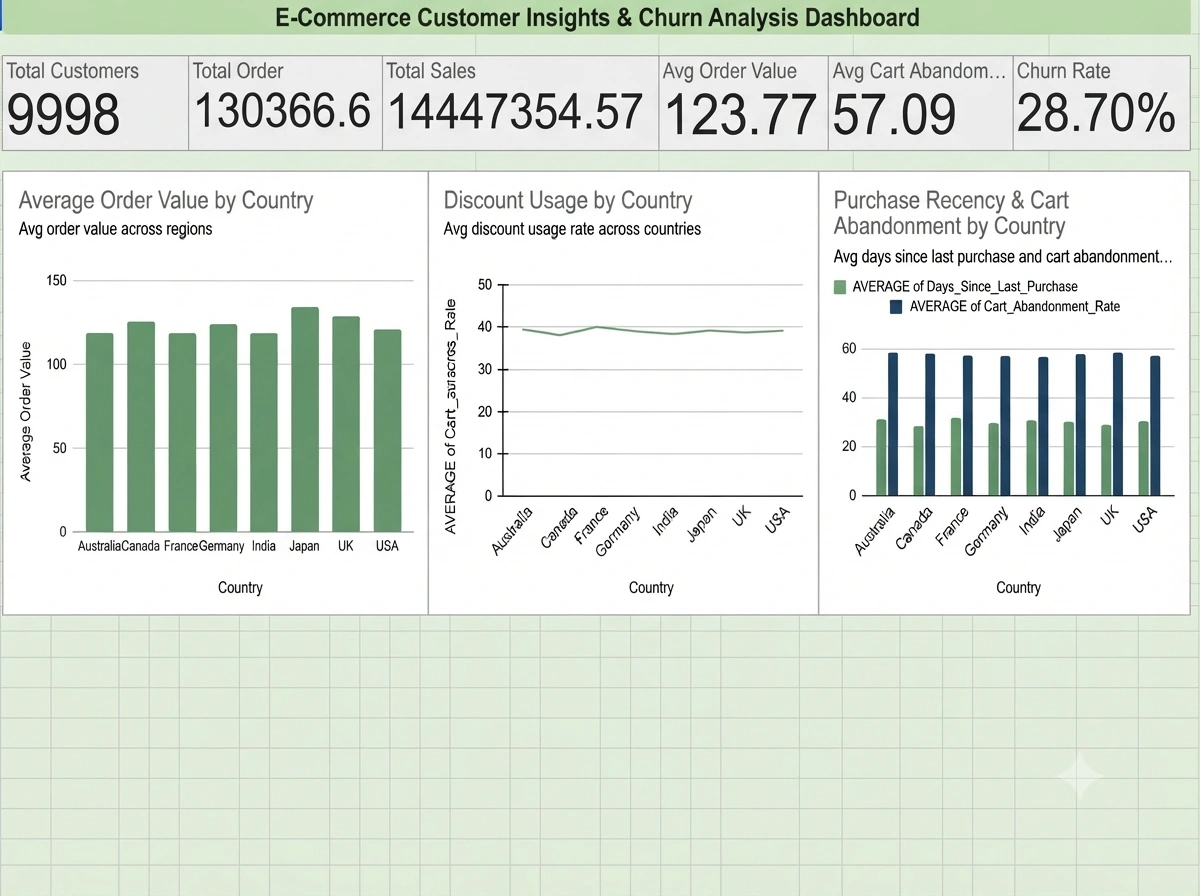
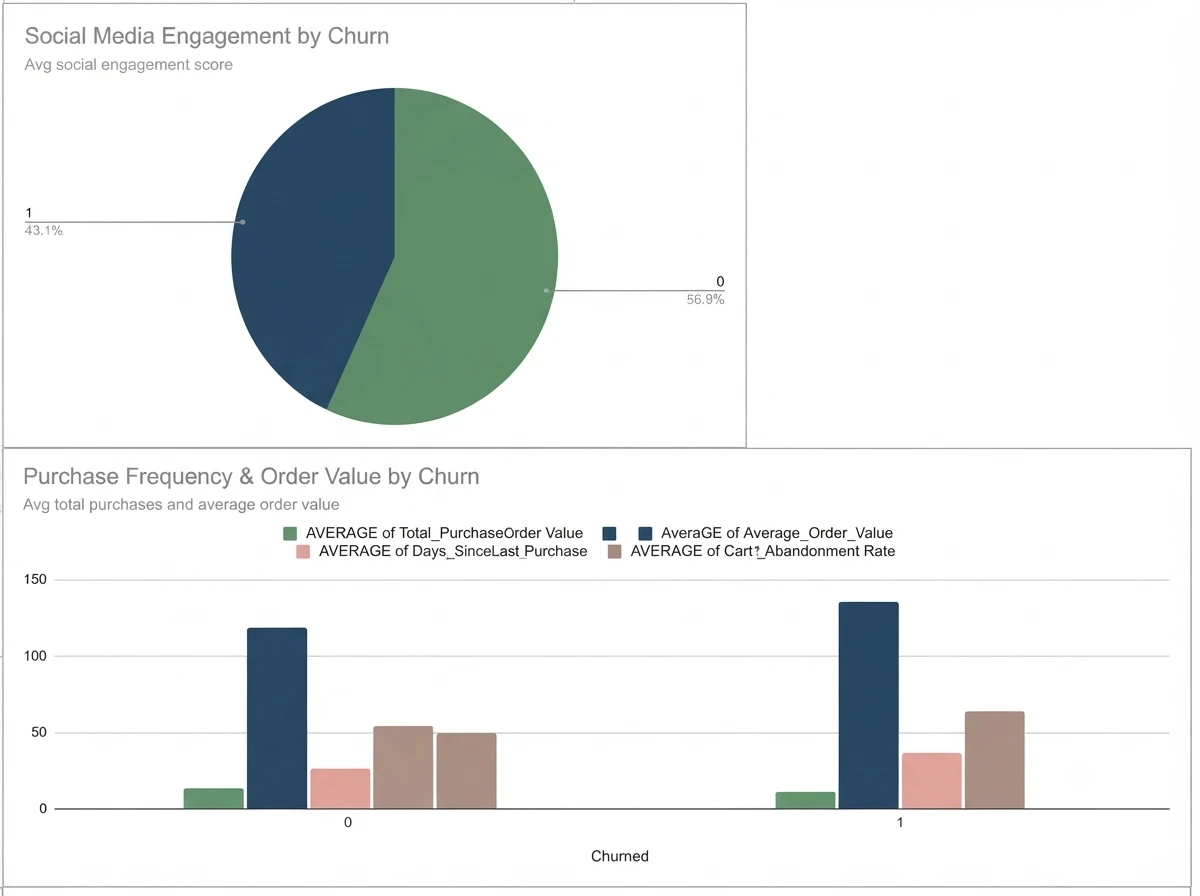
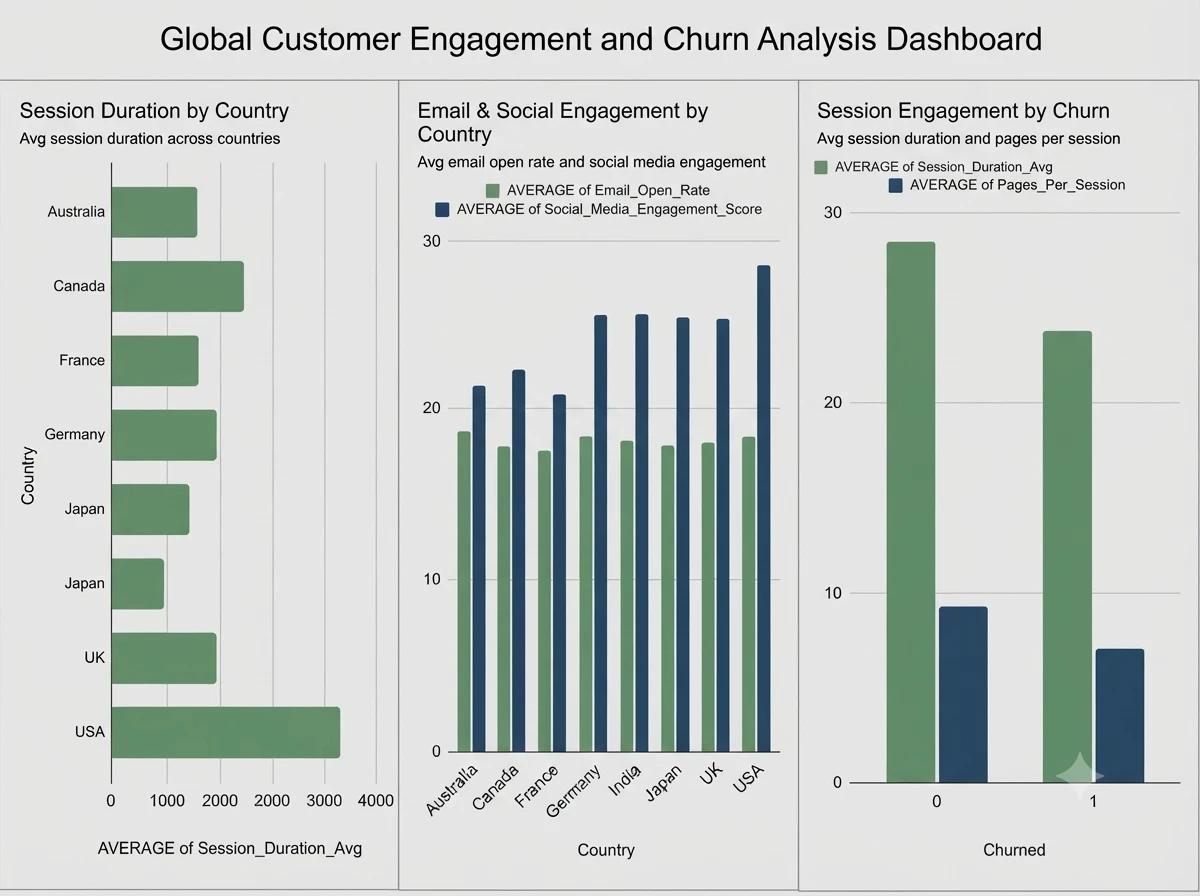
Pivot tables were created to compare churned (1) and active (0) users across engagement, purchasing behavior, demographics, and geography.
The Churned column was used as the primary target variable to identify behavioral changes before customers leave the platform and to determine retention priorities.
Areas of Analysis
Engagement behavior comparison (session duration, login frequency, browsing depth, email engagement, social engagement)
Purchasing behavior trends (purchase frequency, order value, recency, cart abandonment, discount usage)
Demographic segmentation (gender and age distribution)
Geographic segmentation (country-level churn exposure)
Data quality transparency using derived variable Social_Score_Missing
Key Insights
Churned customers showed consistently lower login frequency, session duration, and pages per session, indicating early disengagement.
Higher Days_Since_Last_Purchase strongly aligned with churn risk, confirming recency as a major predictor.
Churned users had lower total purchases, reducing overall revenue contribution.
Higher cart abandonment rates and heavy discount dependency were linked to high-risk segments.
Lower email open rates and social media engagement scores signaled weakening brand connection.
Certain geographic regions showed higher churn exposure, helping prioritize retention strategies.
Tools Used
Excel / Google Sheets (data cleaning and pivot analysis)
Median imputation techniques
Exploratory data analysis methods
Learning Outcomes
Applied logical, business-driven missing value handling
Understood the importance of domain knowledge before preprocessing
Evaluated how imputation impacts analysis quality
Identified engagement patterns linked to churn
Structured and documented a complete data analysis project
Like this project
Posted Oct 28, 2026
Analyzed e-commerce dataset to find customer behavior and churn insights.