Impulse Buying Analysis for Blinkit Revenue Optimization

Arya A


Arya756/SecC_G19_BlinkitDataAnalysis · 1 stars · 1 forks · 0 watching
The Unplanned Basket
Newton School of Technology | Data Visualization & Analytics Capstone Section C, Group 19
How quick-commerce is converting India's weekly grocery list into a daily stream of impulse spending
This project builds an impulse-proxy scoring model across 13,000 SKUs in 10 Indian cities to quantify what share of Blinkit's revenue is planned necessity versus unplanned convenience — and to price the premium consumers pay for that convenience. The work combines Python-based ETL, exploratory analysis, statistical validation, and a four-page Tableau dashboard suite built for business decision-making.
The core question is:
What share of Blinkit's sales is driven by impulse behaviour — and how much more are consumers paying per gram for the convenience of small-pack, quick-delivery formats?
Team Members
Name Email GitHub UsernameAyush Aryan ayush.aryan2024@nst.rishihood.edu.in
Arya756 Aryan Patel aryan.patel2024@nst.rishihood.edu.in aryanpatel99 Garv Verma garv.verma2024@nst.rishihood.edu.in github-handle Pratyush Chouksey pratyush.chouksey2024@nst.rishihood.edu.in github-handle Puneet Takhar puneet.takhar2024@nst.rishihood.edu.in github-handle Tathagat Harsh tathagat.harsh2024@nst.rishihood.edu.in TathagatHarshProject Highlights
Metric ValueSKUs analyzed 13,000 Cities covered 10 Product categories 8 Engineered features 7 Impulse revenue share 21.6% Convenience premium (small vs bulk) 6× Tableau dashboards 4 Statistical tests conducted 5
The analysis shows that impulse buying in quick-commerce is primarily a pricing phenomenon — not a volume one. The convenience premium is real, statistically undeniable, and concentrated in three categories.
Dashboard Suite
The Tableau workbook is available at
tableau/workbook/Blinkit_Analysis_G19.twbx, with dashboard screenshots stored in tableau/screenshots/.1. Market Pulse
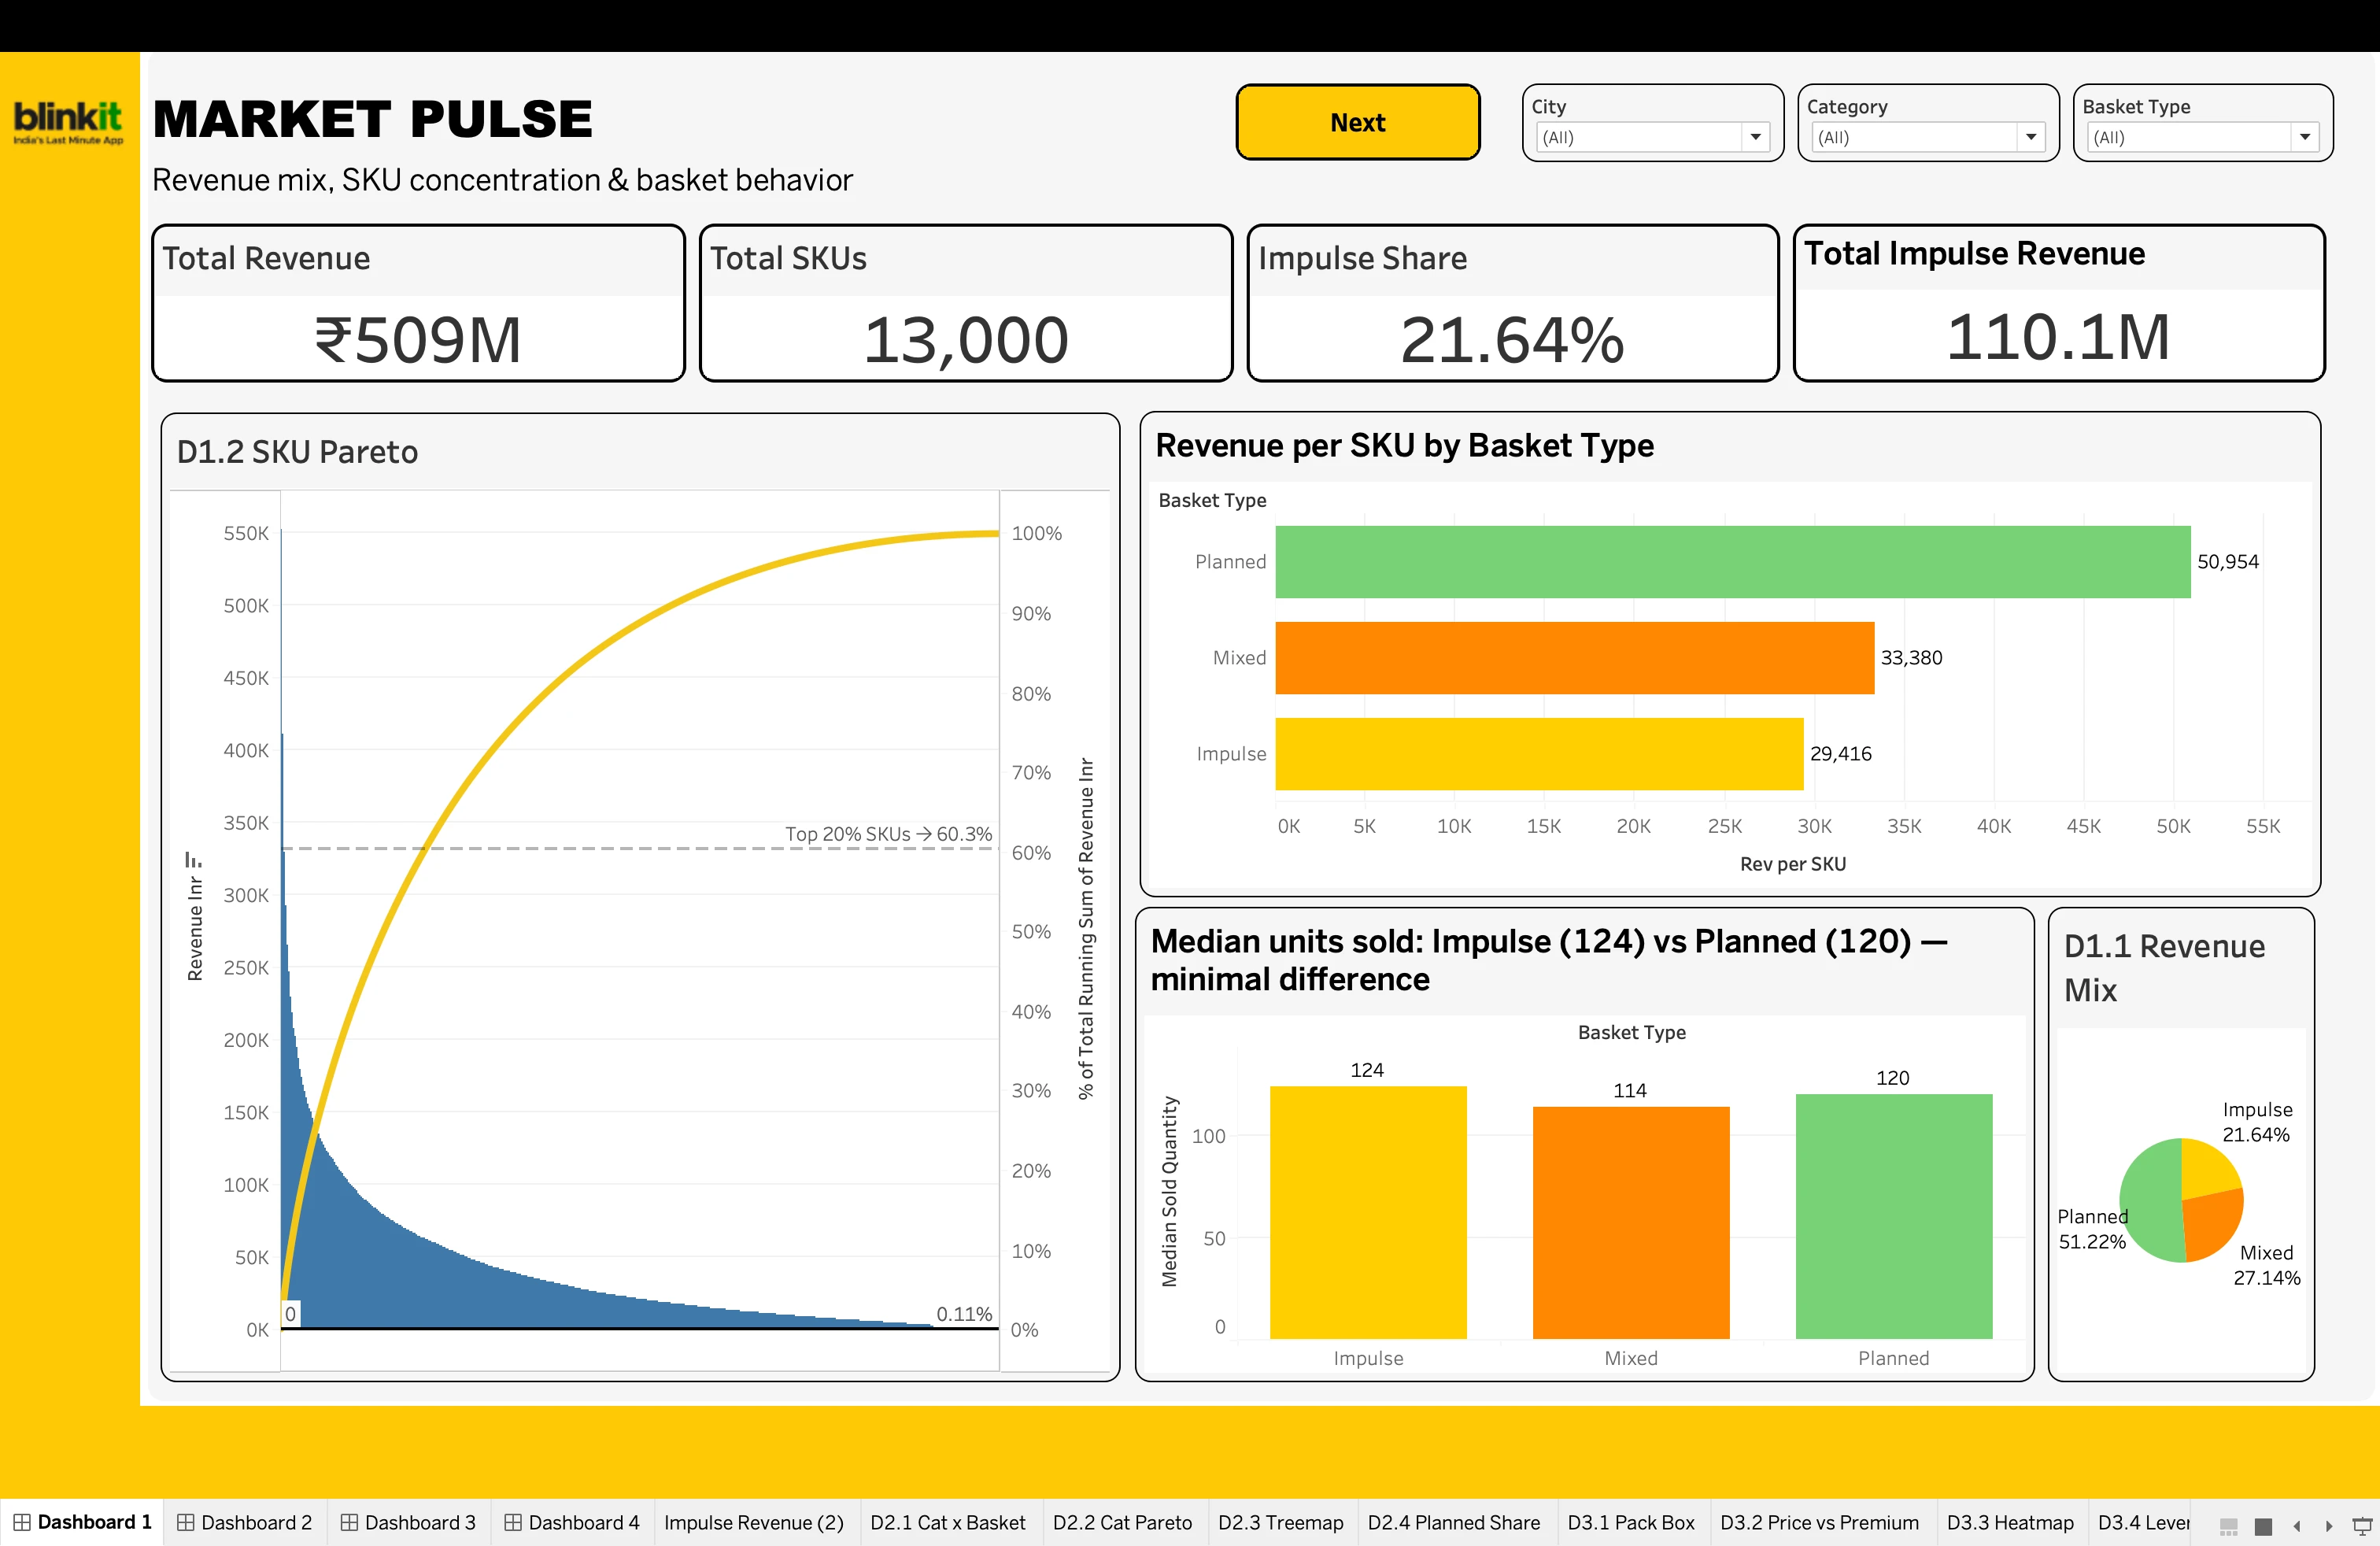
This executive summary dashboard anchors the headline KPIs — total revenue, SKU count, impulse share, and the SKU Pareto curve. It establishes the scale of the impulse layer and sets the context for the deeper views.
Key takeaways
21.6% of total revenue (₹110.1 M) is impulse-driven; when Mixed baskets are included, 48.8% of revenue carries an impulse signal.
The top 20% of SKUs drive 60.3% of revenue — concentrated, but not a classic 80/20.
Revenue per SKU is higher in Planned baskets (₹50.9 K) than Impulse (₹29.4 K), while median units sold per SKU are virtually identical (Impulse 124, Planned 120).
The impulse advantage lives in price architecture, not in extra volume.
2. Where Impulse Lives
This category drill-down dashboard shows where impulse revenue concentrates. It uses a category Pareto, a Cat × Basket composition split, a treemap, and a planned-share lollipop chart to identify which categories are impulse-led versus planned.
Key takeaways
Bakery (₹42.7 M), Fruits & Vegetables (₹33.2 M), and Dairy (₹22.2 M) together deliver 89.1% of all impulse revenue.
Bakery, F&V, and Dairy are 62–70% impulse-led by revenue share.
Personal Care, Grocery, and Household sit above 80% planned — structurally the opposite of the impulse-core categories.
The category Pareto and treemap make concentration visible; the planned-share lollipop identifies which categories cluster near the 80% planned threshold.
3. Pack Price Ladder
This pricing levers dashboard quantifies the pack-size premium. It uses a pack-box plot, a price-vs-premium scatter, and a demand-driver correlation matrix to show where the margin opportunity lives.
Key takeaways
Median price-per-100g: ₹110 for small packs (<300 g) versus ₹18 for bulk (>700 g) — a 6× pack premium (Welch t-test: t=49.40, p≈0.00).
Price-premium correlation is r = 0.80, confirming a strong linear relationship between pack size and per-gram price.
demand_index correlates with sold_quantity at r = 0.91 — the single reliable operational lever in the dataset.All other variables (discount_pct, impulse_score, price_per_100g) sit near zero correlation with volume, confirming margin — not volume — is the natural optimisation axis.
4. Geography & Promo Analysis
This dashboard covers city-level impulse uniformity and the effect of promotional offers. It uses a city map, ranked bar chart, offer-effect box plot, and a discount-vs-quantity scatter to test whether geography or promotions can be used as targeting levers.
Key takeaways
City impulse share ranges from 17.8% (Pune) to 24.9% (Ahmedabad) — a 7.1 pp spread that is within statistical bounds (Kruskal-Wallis, p=0.43), supporting a single national playbook.
The offer-effect box plot shows overlapping distributions across promotional and non-promotional SKUs — demand stays steady regardless of offer status.
The discount-vs-quantity scatter (R² = 0.000) confirms volume is stable across discount depth.
Promotional spend can be redirected to higher-leverage levers (placement, push notifications) without volume risk.
Business Problem
India's quick-commerce platforms deliver groceries in under 10 minutes, eliminating the friction that once separated a craving from a purchase. This near-zero friction environment creates a structural incentive for unplanned buying — but the exact size and economics of that impulse layer in Blinkit's catalogue have never been quantified.
Decision supported:
This analysis enables Blinkit's category and pricing teams to reallocate assortment investment toward high-impulse categories, reprice small-pack SKUs based on empirically validated premiums, and redirect promotional spend away from discounts that do not drive incremental volume.
Dataset
Attribute DetailsDataset Blinkit Product-Level Operational Dataset Source Kaggle Raw file
data/raw/ Cleaned file data/processed/ Raw shape 13,000 SKUs × 25 columns Target variable basket_type (Impulse / Mixed / Planned) Granularity One row per SKU per cityKey Columns Used
Column Name Description Role in Analysis
category Product category (8 types) Impulse classification, segmentation final_price Price after discount (₹) Revenue computation, pricing analysis sold_quantity Units sold Revenue computation, demand analysis weight_g Product weight in grams Pack-size segmentation, convenience premium shelf_life_days Shelf life in days Perishability flag for impulse scoring offer_type Offer type applied Promotional impact testing city City of sale (10 cities) Geographic segmentation discount_pct Discount percentage (0–30%) Pricing and offer analysisFor full column definitions and engineered features, see
docs/data_dictionary.md.Data Preparation
The cleaned dataset was produced through a structured notebook pipeline:
01_extraction.ipynb sources and profiles the Blinkit dataset.02_cleaning.ipynb cleans, imputes, and engineers the impulse proxy features.03_eda.ipynb explores revenue distribution, category breakdown, and city-level patterns.04_statistical_analysis.ipynb runs five hypothesis tests and a linear regression.05_final_load_prep.ipynb prepares the Tableau-ready extract.Key cleaning decisions:
Missing values imputed: median for numeric columns, mode for categorical columns.
offer_type NaN values recoded as "No Offer" to preserve the promotional signal.Duplicates removed and text fields standardised.
Engineered impulse proxy features:
revenue_inr, price_per_100g, weight_bucket, is_perishable, impulse_score, basket_type, city_impulse_index.Impulse score formula:
0.30×is_small + 0.25×is_perishable + 0.25×is_impulse_category + 0.20×has_offer.KPI Framework
KPI Definition Formula / ComputationImpulse Revenue Share % Share of total revenue from impulse-classified SKUs
Σ revenue (basket_type = Impulse) / Σ total revenue × 100 — notebooks/05_final_load_prep.ipynb Convenience Premium Price-per-100g ratio of small vs bulk packs median(price_per_100g, small) / median(price_per_100g, bulk) — notebooks/04_statistical_analysis.ipynb Impulse Score Composite proxy score per SKU for impulse likelihood 0.30×is_small + 0.25×is_perishable + 0.25×is_impulse_category + 0.20×has_offer — notebooks/02_cleaning.ipynb City Impulse Index City's impulse propensity relative to the national average city_mean_impulse_score / global_mean_impulse_score — scripts/etl_pipeline.py Offer Lift Ratio Demand uplift from promotional offers avg_sold_qty_with_offer / avg_sold_qty_no_offer — notebooks/04_statistical_analysis.ipynbStatistical Validation
The project validates dashboard patterns using formal tests at α = 0.05.
Question Feature Test Result DashboardDo small packs charge a pricing premium?
price_per_100g Welch t-test Highly significant (t=49.40, p≈0.00) Pack Price Ladder Do impulse SKUs sell more units than planned? sold_quantity Mann-Whitney U Not significant (p=0.80) Market Pulse Do promotions increase sold quantity? offer_type ANOVA Not significant (p=0.41) Geography & Promo Analysis Is impulse share consistent across cities? city_impulse_index Kruskal-Wallis Not significant (p=0.43) Geography & Promo Analysis Are quantity decisions predictable by standard levers? sold_quantity Linear regression R²≈0.000 (p=0.675) AllThe statistical tests reveal a counterintuitive finding: the variables most associated with impulse behaviour (offers, city) do not drive volume. The impulse premium operates entirely through pricing.
Key Insights
The impulse layer is real and significant. 21.6% of Blinkit's total revenue comes from SKUs with impulse characteristics. When Mixed baskets are included, 48.8% of revenue carries some impulse signal.
Three categories own the impulse business. Bakery (38.8%), Fruits & Vegetables (30.2%), and Dairy (20.1%) together account for 89% of all impulse revenue. These are the categories that must receive priority assortment and supply-chain investment.
Fruits & Vegetables, Bakery, and Dairy are structurally impulse-driven. 62–70% of revenue in these categories comes from impulse-classified SKUs. Personal Care, Grocery, and Household are the opposite — over 80% planned.
Small packs charge a 6× convenience premium. Median price-per-100g is ₹110 for small packs (<300g) versus ₹18 for bulk (>700g). This difference is statistically undeniable (Welch t-test: t=49.40, p≈0.00) and represents the core monetisation lever in quick-commerce.
Impulse is a pricing story, not a volume story. Impulse SKUs do not sell more units than planned SKUs (Mann-Whitney U, p=0.80). The revenue premium comes entirely from higher per-gram prices — not from lifting purchase frequency or basket size.
Offers do not trigger impulse purchases. Promotions do not significantly increase sold quantity (ANOVA, p=0.41). Discount spend is not converting to incremental demand. The impulse decision is driven by category, pack size, and perishability, not price cuts.
Impulse buying is a national urban pattern. City impulse share ranges from 17.8% (Pune) to 24.9% (Ahmedabad), but this variation is not statistically significant (Kruskal-Wallis, p=0.43). A single national assortment and pricing strategy is more defensible than city-by-city customisation.
The Pareto principle partially holds. The top 20% of SKUs drive 60.3% of revenue — concentrated, but not the classic 80/20. A meaningful long tail of mid-revenue SKUs contributes to assortment depth and cannot be pruned without consequence.
demand_index is a reliable operational proxy. Correlation between demand_index and sold_quantity is 0.91 — it can be used confidently in inventory and supply-chain planning without requiring transactional history.Consumer quantity decisions are not explained by standard levers. Linear regression of
sold_quantity on impulse score, offers, price, and discount produces R² ≈ 0.000 (F-stat p=0.675). Volume is driven by factors outside this dataset — likely habit, household need, and availability.Recommendations
# Recommendation Evidence Expected Impact1 Rebalance assortment investment toward Bakery, Fruits & Vegetables, and Dairy with disproportionate shelf-space and supply-chain priority. These three categories drive 89% of all impulse revenue. Higher impulse revenue capture; reduced stockouts in the highest-margin basket type. 2 Expand small-pack SKUs in mid-performing impulse categories (Snacks, Beverages) where the premium is currently under-exploited. Small packs charge a 6× per-gram premium over bulk alternatives. Increased margin-per-transaction without volume investment. 3 Redirect promotional spend from price discounts to visibility investments — placement, push notifications, in-app placement. Offers do not lift demand significantly (ANOVA, p=0.41). Same or better demand at lower promotional cost. 4 Deploy a single national impulse-assortment playbook rather than city-customised approaches. City impulse share variation is not statistically significant (Kruskal-Wallis, p=0.43). Faster rollout, consistent margin performance, reduced localisation overhead. 5 Build pricing models around price-per-100g economics rather than absolute price to optimise margin extraction across pack-size tiers. Impulse is a pricing phenomenon confirmed by Welch t-test (t=49.40, p≈0.00). Defensible pricing architecture grounded in empirically validated consumer willingness-to-pay.
Repository Structure
Tech Stack
Tool PurposePython Data extraction, cleaning, EDA, statistical analysis Jupyter Notebook Reproducible analytical workflow Tableau Public Interactive dashboard design and publishing GitHub Version control and project collaboration CSV Raw and processed data storage
Python libraries used:
pandas, numpy, matplotlib, seaborn, scipy, statsmodelsHow To Run Locally
Run notebooks in order:
01_extraction → 02_cleaning → 03_eda → 04_statistical_analysis → 05_final_load_prepOr run the standalone pipeline:
Open the Tableau workbook from
tableau/workbook/Blinkit_Analysis_G19.twbx to inspect or modify the dashboard suite.Current Deliverables
Cleaned dataset:
data/processed/Data dictionary:
docs/data_dictionary.mdAnalysis notebooks:
notebooks/Standalone ETL pipeline:
scripts/etl_pipeline.pyTableau workbook:
tableau/workbook/Blinkit_Analysis_G19.twbxTableau Public: Live Dashboard
Dashboard screenshots:
tableau/screenshots/Final report:
reports/The_Unplanned_Basket_Final_Report.pdfConclusion
The Blinkit data shows that impulse buying is not driven by what the campaign industry typically assumes. Offers do not move the needle. Cities do not behave differently enough to warrant customisation. Volume is not the mechanism. Instead, the convenience premium is a structural pricing phenomenon — small packs command 6× the per-gram price of bulk alternatives, and the categories that benefit most (Bakery, Fruits & Vegetables, Dairy) are the same categories that attract the highest impulse share.
The actionable path is clear: prioritise the three impulse-dominant categories, expand small-pack assortment in underserved segments, reallocate promotional budget from discounts to placement, and operate a single national strategy rather than fragmented city-level approaches.
Together, the Python analysis and Tableau dashboards provide a complete decision framework for improving Blinkit's impulse revenue capture and pricing architecture.
Contribution Matrix
Team Member Dataset & Sourcing ETL & Cleaning EDA & Analysis Statistical Analysis Tableau Dashboard Report Writing PPT & VivaAryan Patel Owner/Support Owner/Support Owner/Support Owner/Support Owner/Support Owner/Support Owner/Support Ayush Aryan Owner/Support Owner/Support Owner/Support Owner/Support Owner/Support Owner/Support Owner/Support Pratyush Chouksey Owner/Support Owner/Support Garv Verma Puneet Takhar Tathagat Harsh Owner/Support Owner/Support Support
Team Lead: Ayush Aryan
Date: April 2026
Newton School of Technology — Data Visualization & Analytics | Capstone 2
Like this project
Posted Oct 27, 2026
Developed a data analysis model for Blinkit to study the impact of impulse buying on revenue through a Python and Tableau-driven approach.
Likes
0
Views
1
Timeline
Jan 1, 2026 - Apr 30, 2026