The network for creativity
Join 1.25M professional creatives like you
Connect with clients, get discovered, and run your business 100% commission-free
Creatives on Contra have earned over $150M and we are just getting started
Back to feedPost
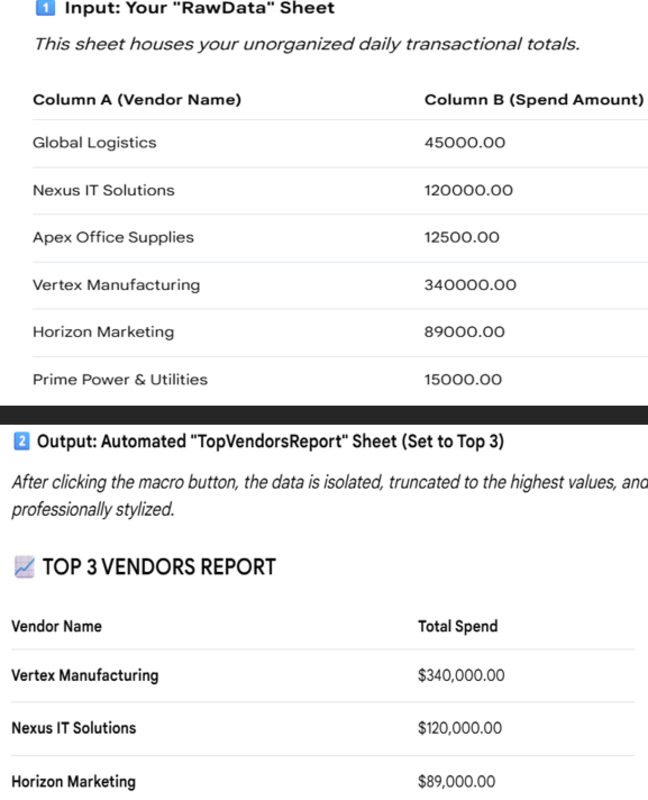
Generating an automated Top Vendors Report using an Excel Macro moves client data through three distinct phases: Extraction, Isolation, and Visual Enhancement.
Step 1: Data Replication & Sorting – The macro copies original invoice/spend records into a dedicated reporting sheet to preserve the master data. It then sorts the entire list by total spend in descending order.
Step 2: Threshold Trimming – It looks at client data's target (e.g., Top 5 or Top 10) and deletes all rows beneath that cutoff, cleanly removing lower-tier spend data.
Step 3: Executive Formatting – It dynamically builds professional headers, applies currency styling ($#,##0.00), colors the table headers for a dashboard feel, and auto-adjusts column widths so text is never cut off.
.



Thanks Manish!!
The network for creativity
Join 1.25M professional creatives like you
Connect with clients, get discovered, and run your business 100% commission-free
Creatives on Contra have earned over $150M and we are just getting started





Related posts

"We can't afford a data analyst."
I've heard this from 3 different startups this year.
So I built one.
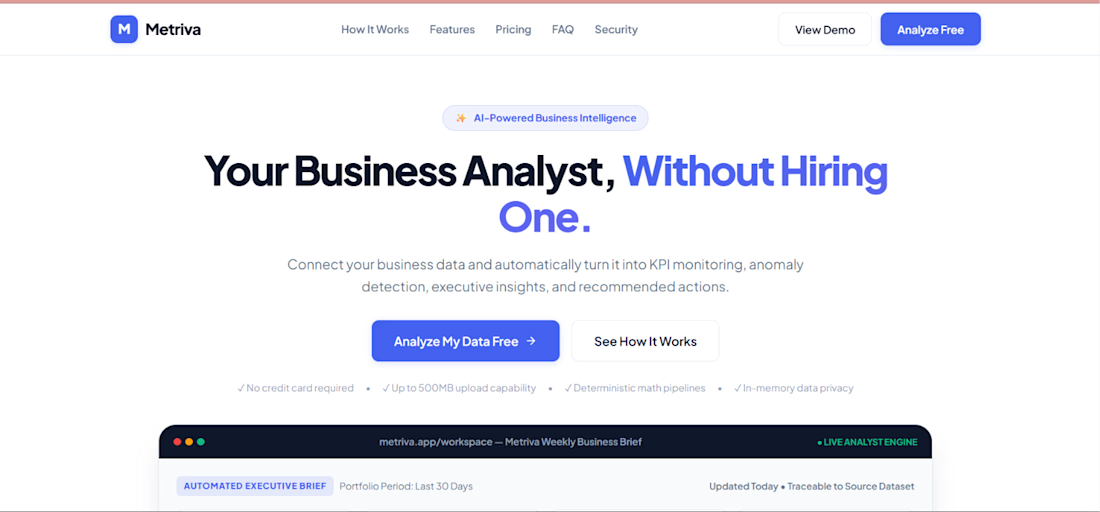
Metriva is an AI-powered business analyst that:
📊 Turns messy spreadsheets into executive dashboards
🧠 Writes C-level business briefs automatically
📈 Forecasts trends + detects anomalies
💬 Answers questions about your data in plain English
🎯 Finds your Pareto 80/20 — who drives 80% of your revenue?
No SQL. No Python. No data team.
Just upload your file and get answers.
Built with Flask, vanilla JS, and a lot of late nights.
🔗 Try it: metriva.ai1.vercel.app
#AI #BusinessIntelligence #Founder #IndieHacker #DataScience
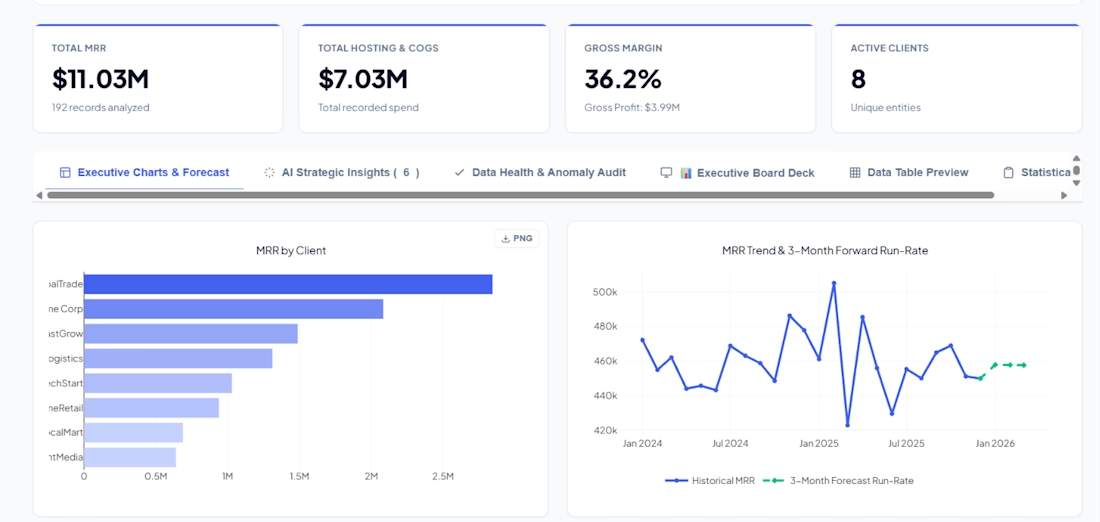
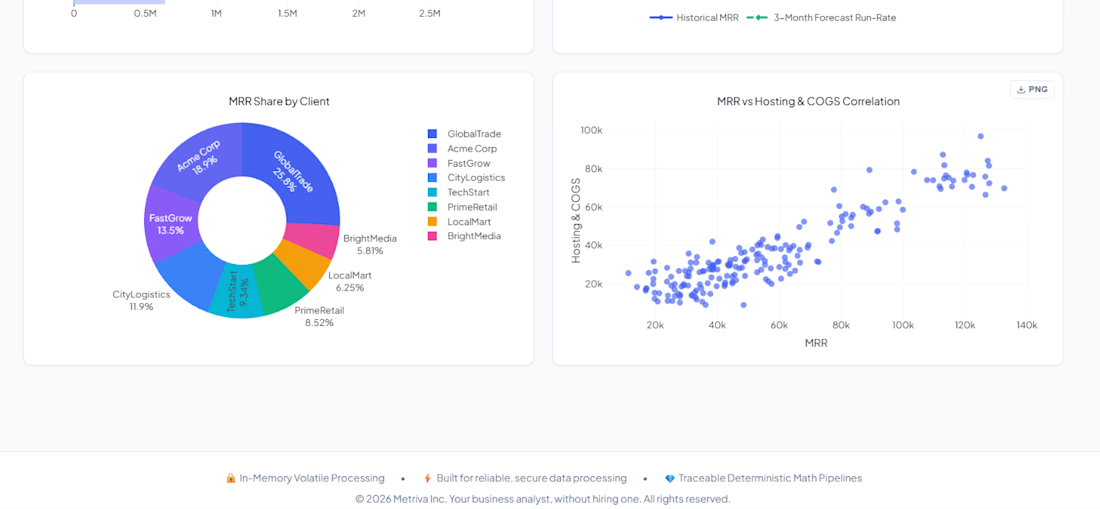

The brief-writing piece is interesting — curious how you handle the validation step. AI-generated language tends to sound confident even when the underlying data is sparse or the trend is ambiguous. One pattern that helps: have the model output a confidence signal alongside the...

Project Title:
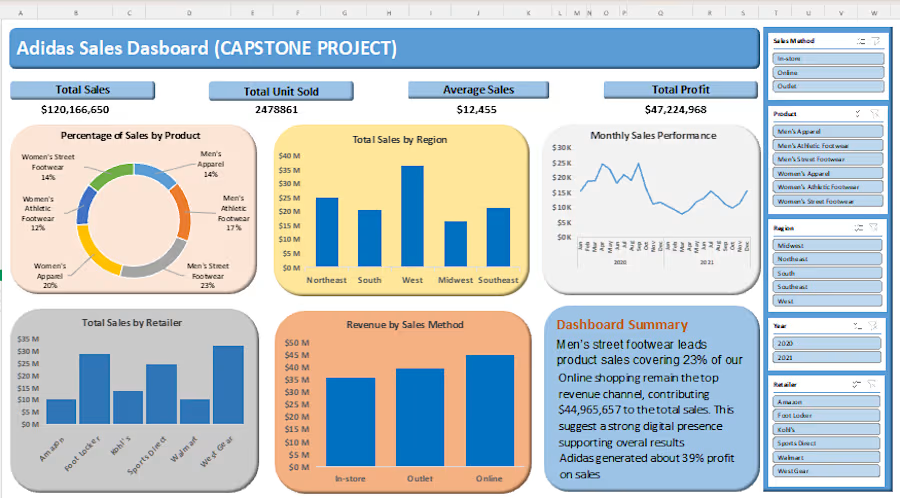
Adidas Sales Performance & Profitability Analysis (Capstone Project)
Overview:
A comprehensive interactive Excel analytics dashboard developed as a Capstone Project to analyze Adidas' overall sales revenue, unit distribution, regional performance, and profit margins. This dashboard transforms raw retail data into executive-ready visuals that highlight top-performing channels, regional growth opportunities, and product category trends.

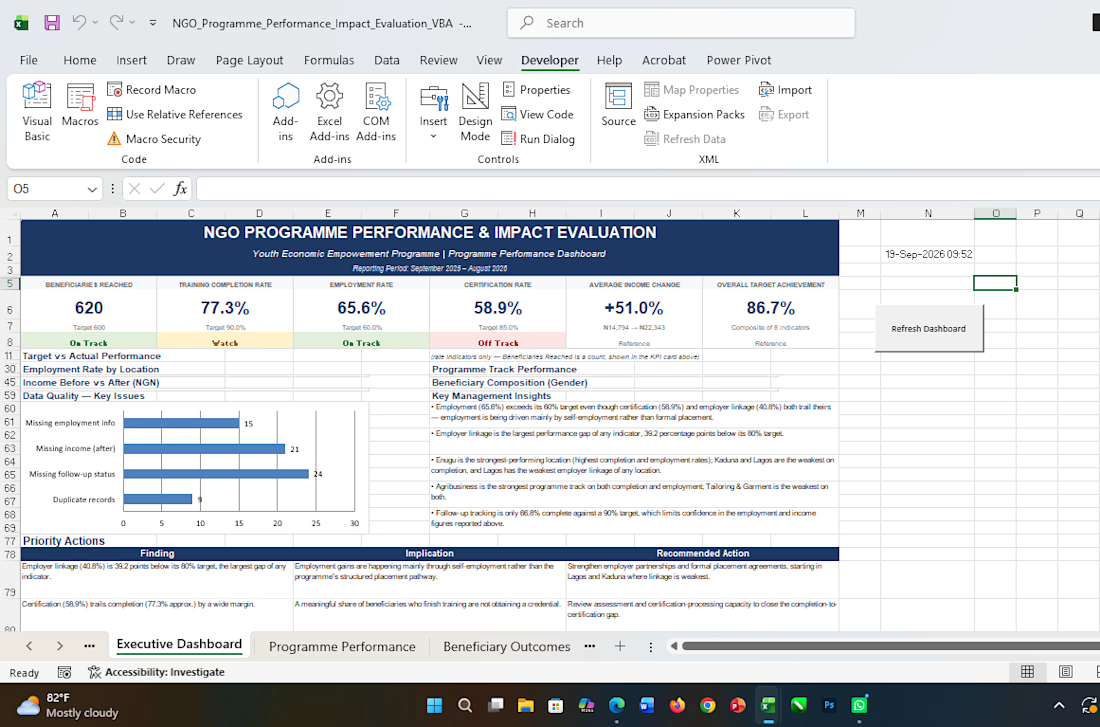
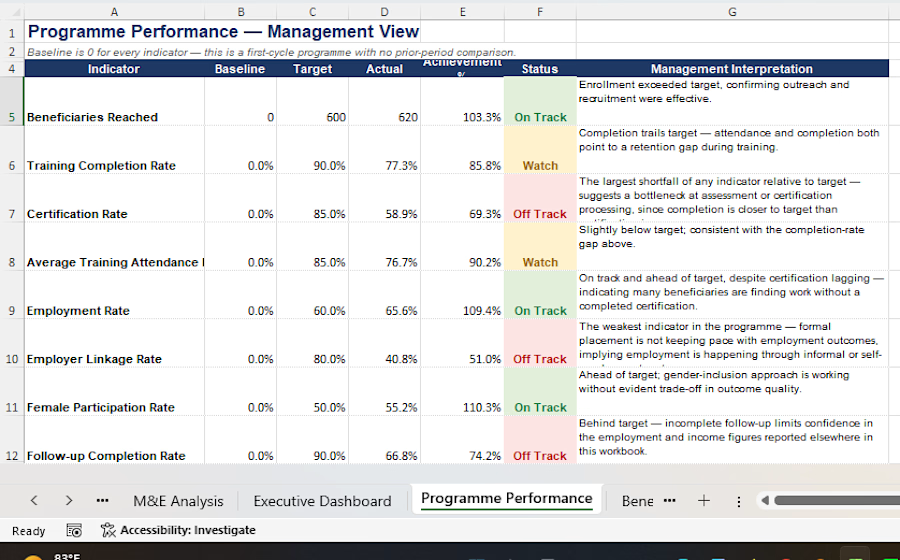
Developed an Excel-based Monitoring & Evaluation dashboard for a simulated NGO youth economic empowerment programme. The project covered data quality assessment, M&E indicator and KPI tracking, target-versus-actual performance analysis, beneficiary outcomes, employment and income analysis, and executive reporting.
I also implemented VBA automation to streamline dashboard refreshes, validate KPIs, check duplicate IDs and missing data, refresh charts, update timestamps, and maintain an automation log. The project demonstrates how programme data can be transformed into practical insights for monitoring performance and supporting evidence-based decision-making.